Share This Article
No items found.

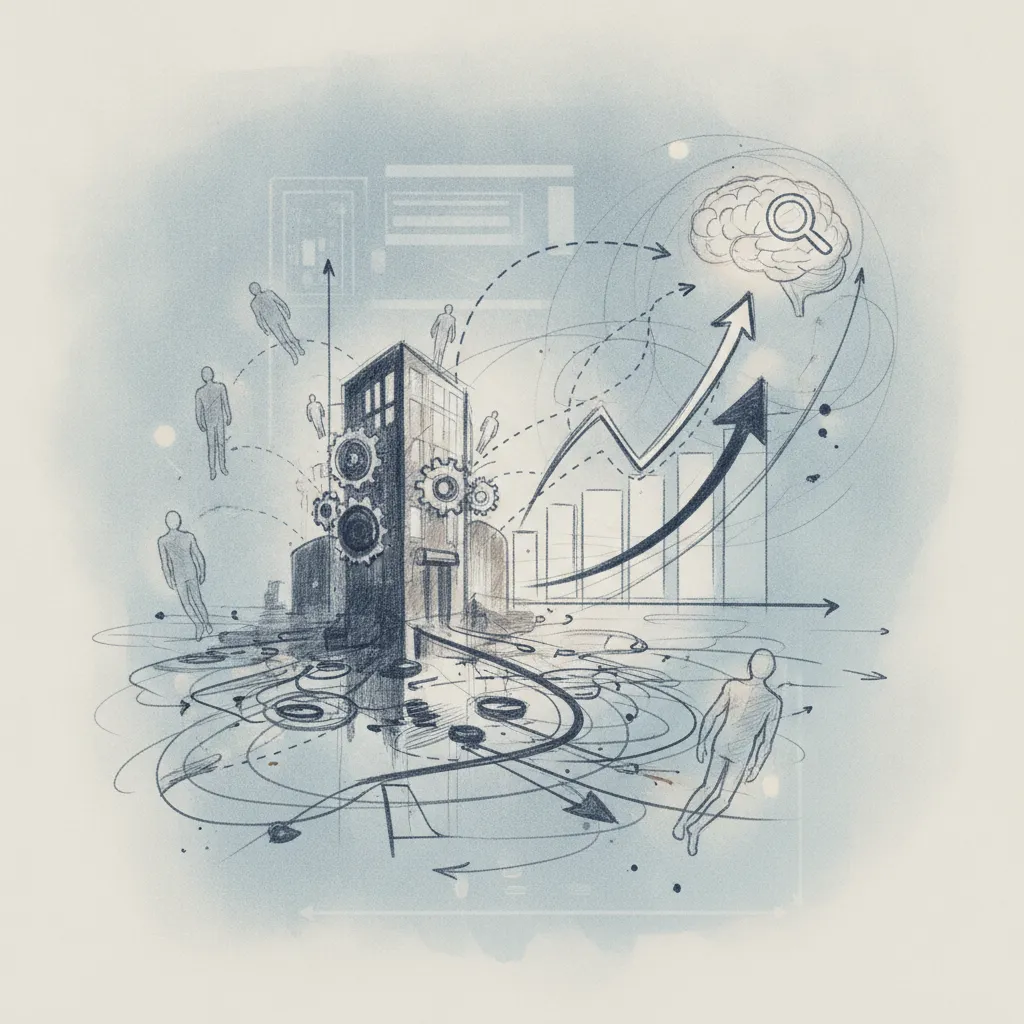
Workplace predictive analytics uses historical workforce data, machine learning, and statistical models to forecast future employee behavior, from turnover risk to space utilization, before problems become costly. Organizations using mature predictive analytics programs report up to 25% reductions in voluntary attrition and real estate savings exceeding 40% by right-sizing space to actual demand. Unlike descriptive HR reporting, predictive analytics shifts decision-making from reactive to proactive, giving leaders a measurable edge on headcount, scheduling, and retention.
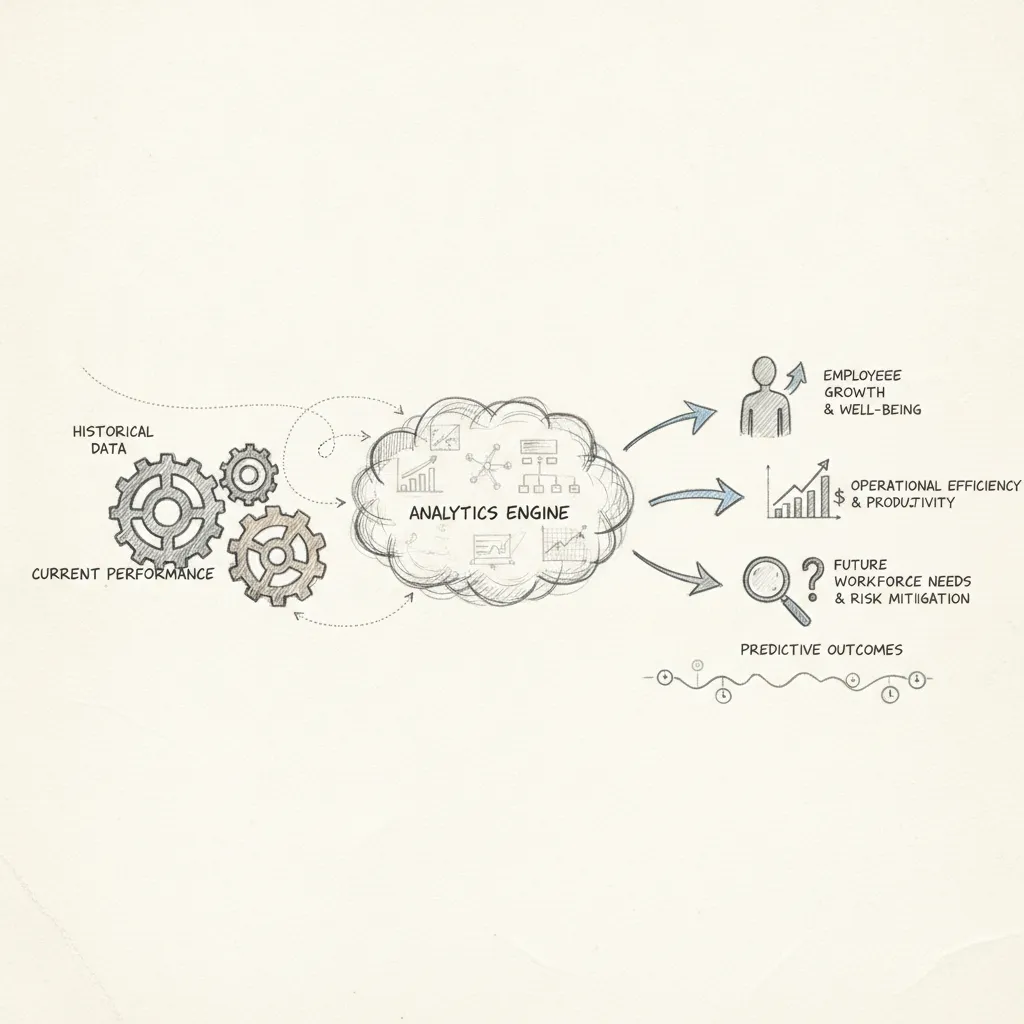
Workplace predictive analytics applies statistical algorithms and machine learning models to historical workforce data to generate probabilistic forecasts about future outcomes.
The inputs span attendance records, badge access logs, HRIS data, employee surveys, scheduling tools, and space utilization sensors. Raw data from these sources is cleaned and integrated into a unified dataset, then used to train predictive models that output probability-weighted forecasts, typically surfaced through dashboards showing confidence scores alongside each prediction.
That four-stage pipeline, collection, cleaning and integration, model training, output, is what separates a genuine predictive program from a reporting exercise.
According to SHRM's research on predictive analytics in talent management, organizations that invest in structured predictive programs consistently outperform peers on both retention and workforce planning outcomes.
"Predictive analytics allows HR leaders to move from describing what happened to anticipating what will happen — and that shift fundamentally changes how organizations invest in their people." — Dr. Tomas Chamorro-Premuzic, Chief Innovation Officer at ManpowerGroup and Professor of Business Psychology, University College London
Most HR and real estate teams operate at the descriptive layer: they can tell you what happened last quarter, average occupancy, headcount changes, attrition rates [3]. Predictive analytics answers what is likely to happen next. Prescriptive analytics goes one step further and recommends a specific action to change that outcome.
The gap between descriptive and predictive is where most organizations stall [3]. They have dashboards full of historical data but no model to project forward from it, which means decisions still rely on intuition rather than probability.
Models trained on historical promotion or performance data can encode past discrimination directly into future predictions. If a workforce historically promoted fewer women into senior roles, a model trained on that data will replicate the pattern unless explicitly corrected.
Regular bias audits and disparate-impact testing are non-negotiable implementation steps, not optional refinements. The EU AI Act classifies AI systems that evaluate workers as high-risk, which triggers mandatory transparency, human oversight, and documentation requirements before deployment.
GDPR Article 22 restricts automated decision-making that produces legal or similarly significant effects on individuals, which covers many workforce predictions if acted upon without human review. Organizations must document the logic behind predictions and give employees meaningful recourse.
The EU AI Act's high-risk classification for worker-evaluation systems adds a second layer: conformity assessments, risk management documentation, and human oversight controls must be built into the system architecture from day one, not retrofitted after deployment.
Both frameworks apply regardless of where the vendor is headquartered, provided the data subjects are EU residents, a detail that catches many global enterprises off guard during procurement.
Workplace predictive analytics draws on five core methods, each suited to a distinct forecasting problem:
Attrition modeling typically starts with logistic regression, which outputs a probability that a given employee will leave within a defined window. When the timing of departure matters, not just whether someone will leave, Cox proportional hazards (survival analysis) is the stronger choice. It models time-to-departure as a function of variables like tenure, compensation band, and promotion recency, making it the preferred method for workforce planning tied to headcount timelines.
For performance prediction, random forests and gradient boosting models (XGBoost in particular) outperform single-model approaches. They handle non-linear relationships between variables, tenure, manager rating, commute distance, absenteeism, that logistic regression flattens. A model trained on 18–24 months of historical HRIS exit data, with features engineered from performance reviews, badge swipes, and compensation history, can output a per-employee risk score refreshed weekly.
NLP sentiment analysis applied to engagement survey free-text, and to internal communication metadata (volume and frequency, not message content), can surface flight-risk signals 60–90 days before a resignation [3]. This lead time is long enough for a manager to intervene.
Clustering algorithms like k-means and DBSCAN serve a different function: segmenting the workforce into behavioral cohorts. Which teams come in on Tuesdays? Which are remote-first? That segmentation feeds directly into space demand forecasting and desk-to-headcount ratio optimization, the kind of attendance pattern modeling that platforms like Upflex apply through AI-driven attendance forecasting to help real estate leaders right-size their office portfolios.
"The organizations winning with workforce analytics are not the ones with the most data — they are the ones that have connected the right data to the right business question and built a feedback loop between prediction and action." — Dawn Klinghoffer, Head of People Analytics at Microsoft
Workplace predictive analytics typically delivers payback within 9–18 months, with documented savings spanning real estate, attrition, and hiring costs.
The clearest way to build a board-ready business case is to stack three cost categories against the total investment required.
On the cost side, calculate the cost of a wrong hire (onboarding, lost productivity, and replacement fees), the cost of an empty desk (your lease rate per square foot multiplied by unused days), and the cost of unplanned absence (overtime, contractor fill-in, and output gaps). Set that against the platform license, any data engineering headcount, and change management effort.
Attrition alone justifies the math quickly. SHRM benchmarks replacing a mid-level employee at 50–200% of annual salary [1]. In a 500-person organization paying $80K average salary, cutting voluntary turnover by 10 percentage points saves $4M–$8M annually, before touching a single lease.
Space is the second lever. Organizations using predictive occupancy analytics report 30–40% reductions in real estate footprint [3]. Translated to dollars: if your firm pays $60 per square foot across 50,000 square feet, a 35% reduction frees roughly $1.05M per year. Upflex customers have documented 40%+ reductions in real estate spend using AI-powered attendance forecasting, a figure that maps directly onto this framework.
According to Google Cloud's overview of predictive analytics, the most impactful implementations share a common trait: they tie model outputs directly to financial decisions rather than treating analytics as a standalone reporting function.
Unilever applied predictive screening analytics to its hiring process and cut time-to-hire by 75% while increasing the diversity of candidate shortlists, a documented enterprise result that shows the model working at scale [1].
A major US bank deployed predictive attrition models in its contact center, identified employees at high flight risk, and ran targeted retention interventions. Within two quarters, quarterly churn dropped 20%, a result achieved without blanket pay increases or policy mandates.
Both cases share a pattern: the model surfaced a specific risk, the organization acted on it, and the outcome was measurable within months rather than years.
A workplace predictive analytics program runs from data audit to scaled deployment in 12 months across four phases, with mid-market budgets ranging from $20K to $200K total.
Start by inventorying every data source you own: HRIS records, ATS outputs, badge access logs, and scheduling data. Assess each for completeness and PII exposure before a single model is built.
Appoint a data steward on day one. Then form a cross-functional steering group, HR, IT, Legal, and Finance, to align on governance rules and sign off on data access before the project moves forward.
Choose one high-value use case and build around it. Attrition risk is the most common first project because the data signals are well-understood and the business case is easy to quantify [3].
Set success metrics before building, not after. Target a model AUC above 0.75 and precision above 70% on top-decile risk scores, these thresholds give HR leaders enough confidence to act on the output.
Make a build-vs.-buy decision based on your internal data science capacity. For most mid-market organizations, a SaaS platform is faster and cheaper than building from scratch.
Integrate model outputs directly into existing HRIS dashboards. Adoption dies when analytics live in a separate portal, managers act on risk scores only when they appear in tools they already open every day.
Add a second use case once the first model is stable. Space demand forecasting is a natural next step, platforms like Upflex use AI-powered attendance forecasting to predict which days teams will be in office, feeding directly into real estate consolidation decisions.
Run quarterly bias audits and tie model retraining to each annual performance cycle. A minimum viable team for this entire program is one data analyst, one HR business partner as domain expert, and IT support for API integrations, full in-house data science is optional if you selected a SaaS platform in Phase 3.
Visier leads on data depth, ActivTrak wins on deployment speed, and Workday is the right call if your organization already runs on Workday HCM.
Each platform targets a different buyer profile, which makes the comparison less about which tool is "best" and more about which fits your current infrastructure and team size.
Visier is purpose-built for people analytics at enterprise scale, organizations with 1,000 or more employees. Its attrition modeling and workforce planning modules draw on a dataset of more than 15 million employees [3], giving HR and corporate real estate leaders pre-built benchmarks that in-house teams would take years to replicate. Pricing starts around $20 per employee per year. For workplace predictive analytics programs that need custom model building and broad data source ingestion, Visier is the strongest standalone option.
ActivTrak focuses on activity data, app usage, work patterns, and productivity signals, making it well-suited for hybrid teams that need real-time visibility into how and where work actually happens [3]. Deployment is faster than either Visier or Workday, and pricing is more accessible for mid-market buyers. The trade-off: monitoring employee activity carries reputational risk, so a clear internal communication policy is non-negotiable before rollout. For a detailed breakdown of how activity-based analytics works in practice, see ActivTrak's guide to predictive workforce analytics.
Workday People Analytics surfaces anomalies automatically through augmented analytics and integrates without friction for organizations already running Workday HCM. That native integration eliminates the data pipeline overhead that trips up most analytics projects. Its weakness is flexibility, custom model building is limited compared to Visier or a standalone data science stack.
| Axis | Visier | ActivTrak | Workday |
|---|---|---|---|
| Data source breadth | ✓ Strongest | Activity data only | HRIS-bound |
| Deployment speed | Moderate | ✓ Fastest | Moderate |
| HRIS-native integration | Requires connectors | Requires connectors | ✓ Best for existing customers |
| Custom ML flexibility | ✓ High | Low | Low |
The buying decision follows a simple rule: organizations under 500 employees with no dedicated data science team should start with ActivTrak or Workday's native analytics. Enterprises managing complex retention challenges and existing data infrastructure, or those pairing analytics with space optimization platforms like Upflex, which forecasts office attendance with 97% accuracy, should evaluate Visier for the modeling depth that scale demands.
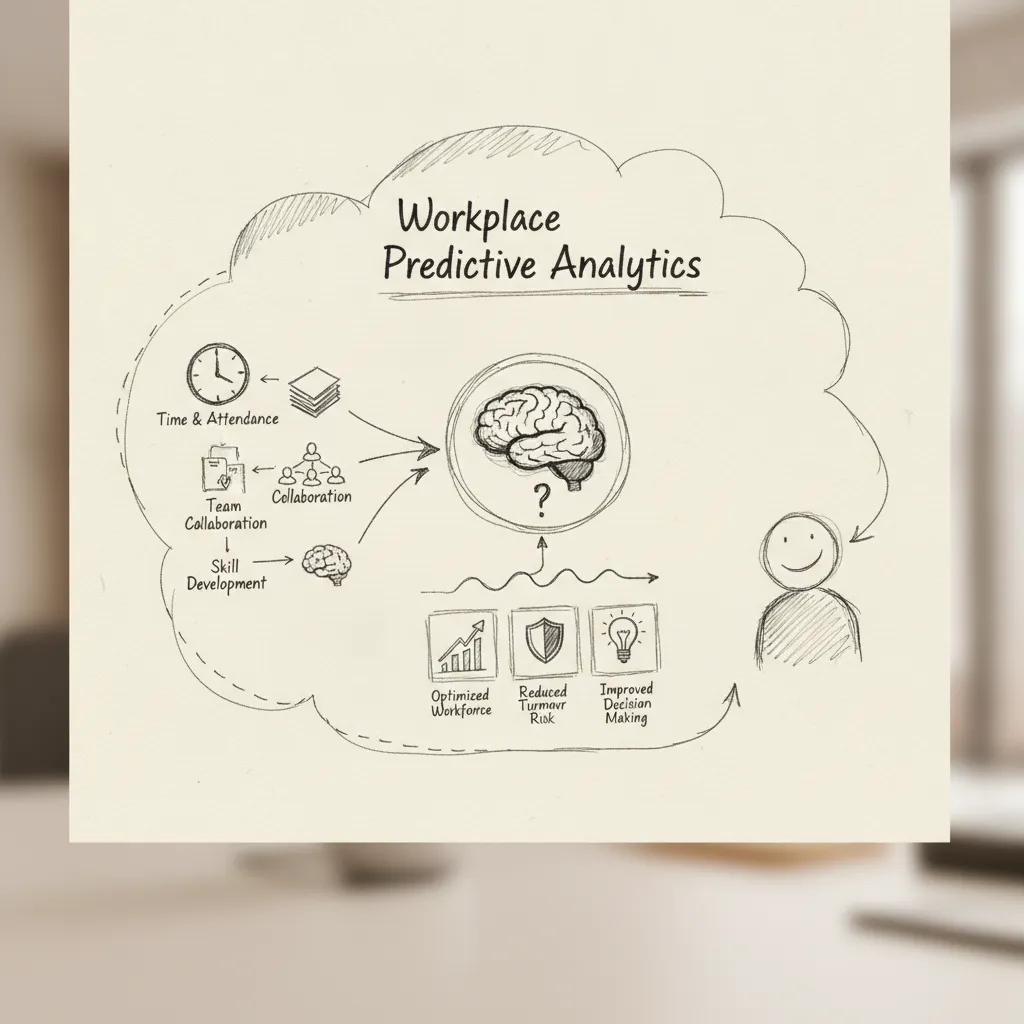
Workplace predictive analytics draws on HR systems, badge access logs, calendar data, desk booking records, and employee surveys [3]. Most platforms also ingest payroll data, performance reviews, and scheduling inputs to build accurate forecasting models. The more integrated the data sources, the more reliable the predictions, which is why platforms that consolidate badge data, booking behavior, and scheduling signals into a single model, as Upflex's UnifyAI engine does, consistently outperform point solutions working from a single data stream.
Yes, mid-market companies with 500 or more employees typically have enough data volume to generate statistically meaningful predictions [3]. Smaller organizations may find that thin historical datasets limit model accuracy in the early months. Starting with a focused use case, attendance forecasting or turnover risk, rather than trying to predict everything at once gives smaller teams a faster path to usable results without requiring a dedicated data science team.
Well-trained attrition models typically achieve 70–85% accuracy, though performance varies significantly by industry, data quality, and model design [3]. Models trained on at least 18–24 months of historical HR and engagement data tend to perform at the higher end of that range. Accuracy also degrades when organizations undergo major structural changes, a merger, a return-to-office mandate, or a rapid headcount reduction, because historical patterns no longer reflect the new operating environment.
People analytics is the broader discipline of using employee data to inform HR decisions; predictive analytics is one specific technique within it [2] [3]. People analytics includes descriptive reporting (headcount, turnover rates) and diagnostic analysis (why attrition spiked last quarter). Predictive analytics goes further, using statistical models and machine learning to forecast what will happen next, who will leave, when attendance will peak, or which teams are at risk of disengagement.
Most organizations see initial measurable results within 3–6 months of deploying their first use case, typically attrition risk scoring or attendance forecasting. Full ROI, including real estate savings and retention improvements, is usually documented within 9–18 months. The timeline depends heavily on data readiness: organizations with clean, integrated HRIS and badge data move faster than those that need significant data engineering work before the first model can be trained.
Workplace predictive analytics moves real estate and HR decisions from gut feel to data-driven forecasting, but only when the underlying data is clean, the models are tied to specific business questions, and results are acted on rather than archived in a dashboard.
Three things are worth acting on now: audit the data sources you already have (badge logs, calendar data, booking records) to identify gaps before selecting a platform; start with one high-stakes prediction, attendance or attrition, rather than trying to model everything simultaneously; and measure model accuracy against actual outcomes every quarter so the system improves over time.
If attendance forecasting is your immediate priority, request a demo of Upflex's UnifyAI engine and ask specifically how it achieves 97% forecast accuracy with your existing scheduling data, that conversation will tell you quickly whether your data infrastructure is ready.
Explore more from our content library: