Calculating office utilization has become critical for corporate real estate leaders navigating the post-pandemic workplace landscape. With hybrid work models creating unpredictable attendance patterns and CFOs demanding cost reductions, accurate space utilization measurement isn't optional—it's essential for survival.
Office utilization measures how effectively your workspace is being used relative to its capacity. This calculation reveals whether you're paying for empty desks, identifies peak usage patterns, and provides the data needed to make informed real estate decisions. For organizations spending millions on office space, even a 10% improvement in utilization can translate to substantial cost savings.
The stakes couldn't be higher. Research from 2026 shows that average office utilization rates hover around 60-70%, meaning nearly one-third of expensive real estate sits unused daily [1]. Companies that master utilization calculations are achieving 40% reductions in real estate spend while maintaining employee satisfaction.
This comprehensive guide walks you through proven methods to calculate office utilization, from basic formulas to advanced metrics that drive strategic decisions. You'll learn practical measurement techniques, avoid common calculation pitfalls, and discover how leading organizations are leveraging utilization data to optimize their workplace portfolios.
What You'll Need to Calculate Office Utilization
Before diving into calculations, you need reliable data collection systems and clear measurement parameters. Office utilization calculations are only as accurate as the underlying data you're working with.
Essential Data Collection Tools
Your measurement accuracy depends on having the right tools in place:
- Badge/keycard access systems that track entry and exit times
- Desk booking software to monitor reservation patterns versus actual usage
- Occupancy sensors for real-time headcount data
- Wi-Fi analytics to detect device presence throughout the day
- Manual observation logs for validation and spot-checking
Modern workplace platforms integrate multiple data sources for comprehensive tracking. The General Services Administration recommends combining at least two measurement methods to ensure accuracy [2].
Key Metrics to Define Upfront
Establish clear definitions before starting calculations:
- Total capacity: Maximum number of people your space can accommodate
- Available workstations: Actual desks, offices, and workspaces available for use
- Peak occupancy: Highest number of people present during measurement periods
- Average daily occupancy: Mean headcount across all measurement days
- Measurement timeframe: Daily, weekly, or monthly calculation periods
Pro Tip: Start with a 30-day measurement period to capture typical usage patterns while accounting for holidays, meetings, and seasonal variations.
Step 1: Calculate Basic Office Utilization Rate
The fundamental office utilization calculation provides your baseline metric for space efficiency. This formula tells you what percentage of your available space is actually being used during any given period.
The Core Utilization Formula
Basic office utilization rate = (Average daily occupancy ÷ Total available capacity) × 100
For example, if your office has 200 available workstations and averages 140 people daily, your utilization rate is 70%. This baseline metric immediately reveals whether you have excess capacity or space constraints.
Step-by-Step Calculation Process
- Count total available workstations: Include all desks, offices, and designated work areas
- Track daily occupancy: Record headcount at consistent intervals (hourly or using sensors)
- Calculate daily averages: Sum all daily headcounts and divide by number of measurement days
- Apply the formula: Divide average occupancy by total capacity and multiply by 100
- Validate results: Cross-reference with badge data or booking systems
Understanding Your Results
Utilization rates reveal different optimization opportunities:
| Utilization Rate |
Interpretation |
Action Required |
| Below 50% |
Significant underutilization |
Consider space consolidation |
| 50-70% |
Moderate efficiency |
Optimize layout and policies |
| 70-85% |
Good utilization |
Monitor for growth planning |
| Above 85% |
High utilization |
Plan for expansion or flexible options |
Industry research shows that utilization rates between 70-80% typically provide the best balance of efficiency and employee experience [3].
Step 2: Measure Peak vs. Average Utilization
Peak utilization analysis reveals when your office experiences maximum demand, helping you understand capacity constraints and optimize space allocation throughout the day.
Calculating Peak Utilization
Peak utilization rate = (Maximum daily occupancy ÷ Total available capacity) × 100
Track occupancy levels every hour for at least two weeks to identify consistent peak periods. Most offices experience peaks between 10 AM and 2 PM, but hybrid work patterns are creating new usage spikes.
Time-Based Utilization Analysis
Break down your calculations by time periods to reveal usage patterns:
- Morning rush (8-10 AM): Early arrivals and meeting preparation
- Peak hours (10 AM-2 PM): Maximum collaboration and focus work
- Afternoon decline (2-5 PM): Meeting-heavy period with lower desk usage
- Evening hours (5-7 PM): Overtime workers and late finishers
Weekly and Seasonal Patterns
Calculate utilization rates for each day of the week to identify patterns:
| Day |
Typical Utilization |
Notes |
| Monday |
65-75% |
Gradual ramp-up, some remote work carryover |
| Tuesday-Thursday |
75-85% |
Peak collaboration days |
| Friday |
45-65% |
Highest remote work adoption |
Pro Tip: Use peak utilization data to determine if you need flexible workspace options for overflow capacity rather than permanent expansion.
Step 3: Calculate Space Utilization by Square Footage
Square footage utilization provides a different perspective on space efficiency, measuring how much physical space each person actually uses versus your design capacity.
Square Feet Per Person Formula
Space utilization = Total office square footage ÷ Average daily occupancy
This calculation reveals whether your space allocation aligns with actual usage patterns. Modern offices typically allocate 150-250 square feet per person, including shared areas, but actual utilization often tells a different story.
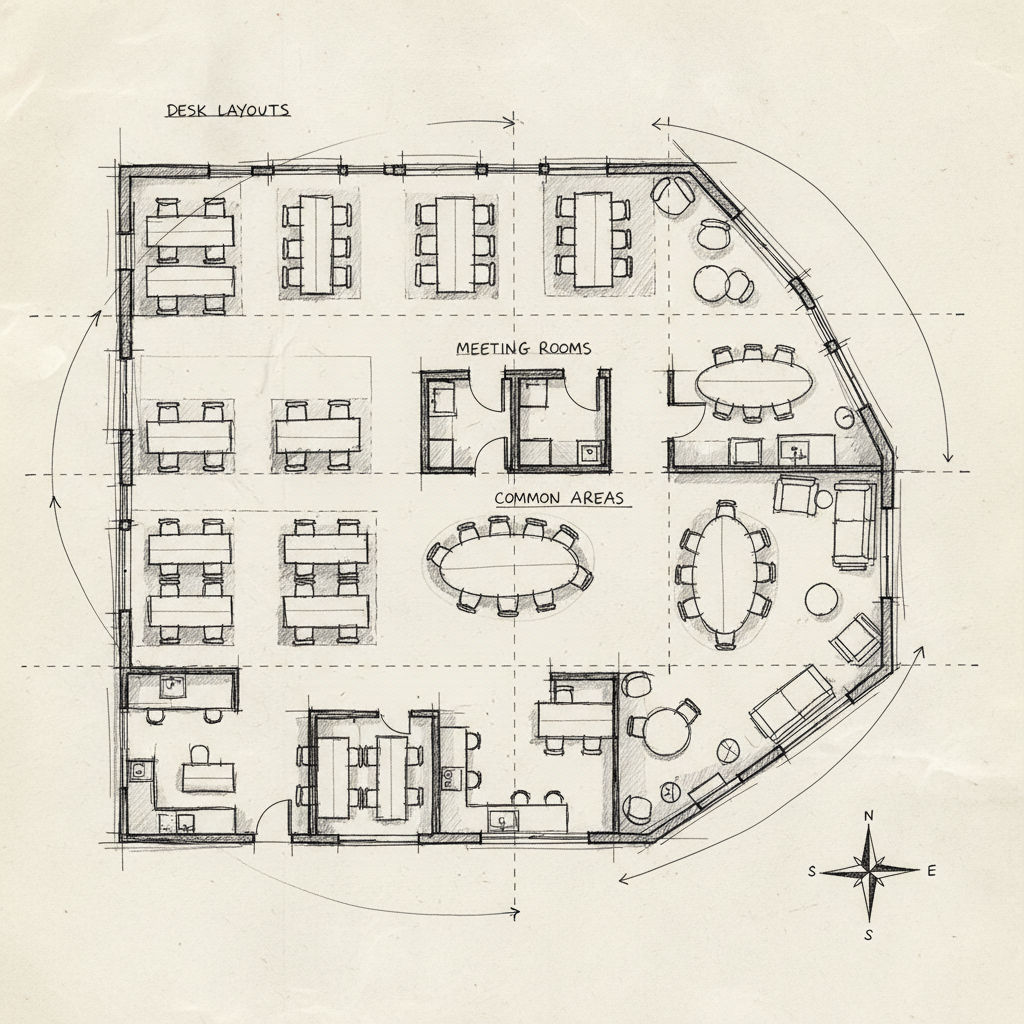
Measuring Different Space Types
Calculate utilization separately for different areas:
- Individual workstations: Dedicated desks and offices
- Collaborative spaces: Meeting rooms, huddle areas, and team zones
- Support areas: Break rooms, copy centers, and storage
- Circulation space: Hallways, lobbies, and pathways
Optimizing Space Allocation
Compare your actual usage against industry benchmarks:
- Dense layouts: 125-150 sq ft per person (high utilization environments)
- Standard layouts: 175-225 sq ft per person (balanced approach)
- Generous layouts: 250-300 sq ft per person (executive or specialized work)
According to the National Fire Protection Association, occupant load calculations must consider both space function and square footage to ensure safety compliance [4].
Step 4: Implement Advanced Utilization Metrics
Beyond basic calculations, advanced metrics provide deeper insights into workspace efficiency and employee behavior patterns that drive strategic real estate decisions.
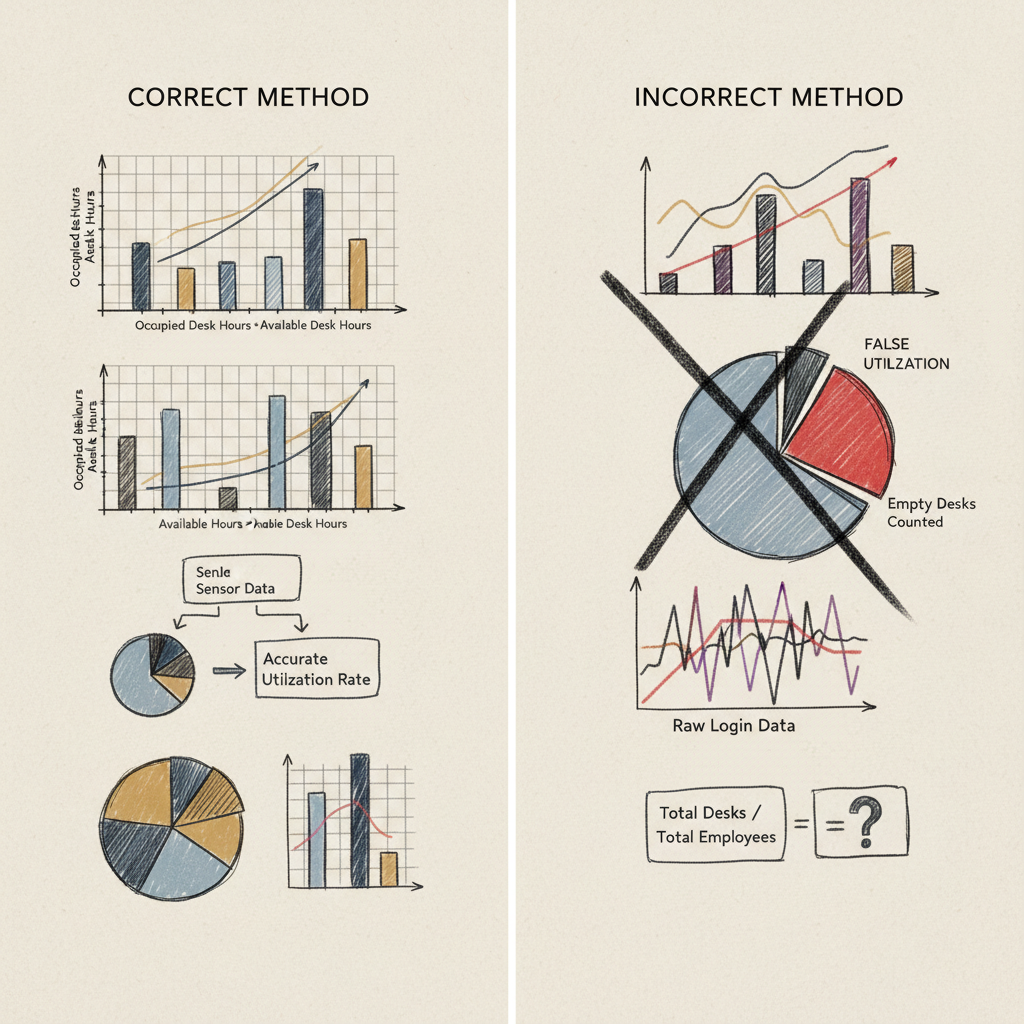
Desk Utilization Rate
Desk utilization = (Total desk hours used ÷ Total desk hours available) × 100
This metric requires tracking individual workstation usage throughout the day. Modern sensors and booking systems make this calculation increasingly accurate, revealing which areas are oversubscribed and which remain consistently empty.
Meeting Room Utilization
Meeting room efficiency = (Actual meeting hours ÷ Reserved meeting hours) × 100
Track both reservation patterns and actual usage to identify ghost bookings and optimize meeting space allocation. Research shows that 30-40% of meeting room reservations go unused, representing significant waste [5].
Cost Per Occupied Seat
Calculate the true cost of utilized workspace:
Cost per occupied seat = Total workplace costs ÷ Average daily occupancy
Include all expenses: rent, utilities, cleaning, security, and amenities. This metric helps justify space optimization investments and compare real estate options.
| Cost Component |
Calculation Method |
Typical % of Total |
| Base Rent |
Annual lease cost ÷ 12 months |
60-70% |
| Utilities |
Monthly bills + estimated usage |
10-15% |
| Maintenance |
Cleaning, repairs, supplies |
8-12% |
| Technology |
Internet, phones, equipment |
5-10% |
| Amenities |
Coffee, snacks, events |
3-8% |
Attendance Prediction Accuracy
For organizations using AI-powered forecasting, calculate prediction accuracy:
Forecast accuracy = 100 - (|Predicted occupancy - Actual occupancy| ÷ Actual occupancy × 100)
Leading workplace platforms achieve 95-97% accuracy in attendance forecasting, enabling proactive space management and resource allocation.
Pro Tip: Combine multiple utilization metrics into a dashboard that updates in real-time. This gives facility managers and executives immediate visibility into space performance.
Step 5: Track Utilization Trends Over Time
Consistent tracking reveals patterns that inform long-term real estate strategy. Single-point measurements can mislead; trends tell the real story of how your workplace is evolving.
Establishing Baseline Measurements
Start with a comprehensive baseline measurement period:
- Collect 90 days of data: Capture seasonal variations and normalize for holidays
- Document measurement methodology: Ensure consistency across future calculations
- Record external factors: Note events, weather, or policies that affect attendance
- Validate data quality: Cross-check different measurement sources for accuracy
Monthly Utilization Reporting
Create standardized monthly reports tracking key metrics:
- Overall utilization rate: Month-over-month percentage change
- Peak day analysis: Highest and lowest utilization days
- Department-level breakdown: Identify teams with different usage patterns
- Cost impact analysis: Financial implications of utilization changes
Seasonal and Event Impact Analysis
Track how external factors influence utilization:
| Factor |
Typical Impact |
Measurement Approach |
| Holiday seasons |
20-40% reduction |
Compare to baseline periods |
| Weather events |
15-25% variation |
Correlate with local weather data |
| Company events |
50-80% increase |
Track event calendar impact |
| Policy changes |
Variable |
Before/after comparison |
Industry data from 2026 shows that successful organizations review utilization trends quarterly and make strategic adjustments based on six-month patterns [6].
Common Mistakes to Avoid When Calculating Office Utilization
Even experienced facility managers make calculation errors that lead to poor real estate decisions. Understanding these pitfalls helps ensure your utilization data drives accurate strategic planning.
Data Collection Errors
- Single-source dependency: Relying only on badge data misses employees who badge in but work elsewhere
- Inconsistent measurement periods: Comparing holiday weeks to normal weeks skews results
- Ignoring visitors and contractors: External workers occupy space but often aren't counted
- Overlooking part-time schedules: Not adjusting capacity calculations for flexible work arrangements
Calculation Methodology Mistakes
The most common error is confusing different types of utilization metrics. Space utilization (square footage per person) differs from occupancy utilization (people present vs. capacity). Mixing these calculations leads to incorrect conclusions about space efficiency.
Misinterpreting Results
High utilization isn't always positive. Utilization rates above 90% often indicate overcrowding, reduced employee satisfaction, and insufficient space for collaboration. The goal is optimization, not maximization.
Pro Tip: Validate your calculations by comparing results across different measurement methods. If badge data shows 80% utilization but sensor data shows 60%, investigate the discrepancy before making decisions.
Timing and Frequency Errors
Many organizations calculate utilization too infrequently or during atypical periods. Monthly snapshots miss important weekly patterns, while annual averages obscure seasonal trends that affect space planning decisions.
Sources & References
- Hubstar, "5 Office Space Utilization Metrics for a Better Workplace in 2026", 2026
- General Services Administration, "GSA occupancy resources", 2026
- Butlr, "Top Strategies to Calculate Office Space Utilization & Efficiency", 2026
- National Fire Protection Association, "How to Calculate Occupant Load", 2020
- Robin, "How to calculate office space and meeting room utilization", 2026
- Deskbird, "12 office utilization metrics for better hybrid workplaces", 2026
- Sign In Solutions, "13 Office Space Utilization Metrics to Maximize Workplace Efficiency", 2026
- Lambent Spaces, "What is Occupancy Utilization?", 2026
Frequently Asked Questions
1. How to calculate office utilization rate?
Calculate office utilization by dividing average daily occupancy by total available capacity, then multiply by 100 for a percentage. For example, if 140 people use a 200-person office daily, the utilization rate is 70%. Track occupancy consistently over 30+ days for accurate results, using badge data, sensors, or booking systems to ensure reliable measurements.
2. What does 75% utilization mean?
A 75% utilization rate means three-quarters of your available workspace is occupied during the measurement period, leaving 25% unused capacity. This typically represents good space efficiency with room for growth and flexibility. Utilization between 70-80% is considered optimal, balancing efficiency with employee comfort and accommodation for peak usage periods. This is particularly relevant for calculate office utilization.
3. What's the difference between occupancy and utilization?
Occupancy measures how many people are present at a specific moment, while utilization calculates the percentage of available space being used over time. Occupancy is a snapshot; utilization is a trend. For example, 50 people in a 100-person office represents 50% occupancy at that moment, but utilization requires averaging occupancy across multiple time periods. When considering calculate office utilization, this point stands out.
4. How often should I calculate office utilization?
Calculate utilization weekly for operational decisions and monthly for strategic planning. Daily calculations help identify patterns, while quarterly reviews inform long-term real estate strategy. Continuous monitoring through sensors or booking systems provides real-time insights, but formal reporting should align with business planning cycles to support decision-making processes. For those exploring calculate office utilization, this matters.
5. What tools do I need to measure office utilization?
Essential tools include badge/keycard systems for entry tracking, occupancy sensors for real-time headcounts, and desk booking software for reservation data. Wi-Fi analytics and manual observation provide additional validation. Modern workplace platforms integrate multiple data sources for comprehensive measurement, while basic calculations can start with simple headcount tracking and spreadsheet analysis. This directly impacts calculate office utilization outcomes.
6. What's considered good office utilization?
Optimal utilization typically ranges from 70-80%, providing efficient space use while maintaining employee comfort and flexibility for peak periods. Below 60% suggests underutilization and potential cost savings through consolidation. Above 85% may indicate overcrowding and the need for additional space or flexible work options to maintain productivity and satisfaction. This is particularly relevant for calculate office utilization.
7. How do I account for hybrid work in utilization calculations?
Track both scheduled and actual attendance patterns, accounting for flexible work policies and remote work days. Calculate utilization based on employees expected to be in-office rather than total headcount. Use booking systems to capture planned attendance and sensors to measure actual usage. Consider peak collaboration days separately from individual work days for accurate hybrid work utilization assessment. When considering calculate office utilization, this point stands out.
Conclusion
Accurate office utilization calculations provide the foundation for smart real estate decisions in 2026's hybrid work environment. By implementing the step-by-step methods outlined in this guide, you'll gain clear visibility into space efficiency, identify optimization opportunities, and build compelling business cases for portfolio changes.
The key to success lies in consistent measurement, comprehensive data collection, and regular trend analysis. Start with basic utilization calculations to establish your baseline, then gradually implement advanced metrics as your measurement capabilities mature. Remember that utilization optimization isn't about maximizing occupancy—it's about creating efficient, flexible workspaces that support both business objectives and employee experience.
Organizations that master these calculations are achieving remarkable results: 40% reductions in real estate spend, improved employee satisfaction, and data-driven confidence in their workplace strategies. The formulas and frameworks in this guide provide your roadmap to similar success.
At Upflex, we've found that combining accurate utilization calculations with AI-powered attendance forecasting creates unprecedented visibility into workspace performance. Our platform helps organizations achieve 97% forecast accuracy while optimizing both owned offices and flexible workspace access—turning utilization data into strategic advantage.
About the Author
Written by the SaaS experts at Upflex. Our team brings years of hands-on experience helping businesses with SaaS, delivering practical guidance grounded in real-world results. For those exploring calculate office utilization, this matters.
Recommended Articles
Explore more from our content library: