Share This Article
No items found.

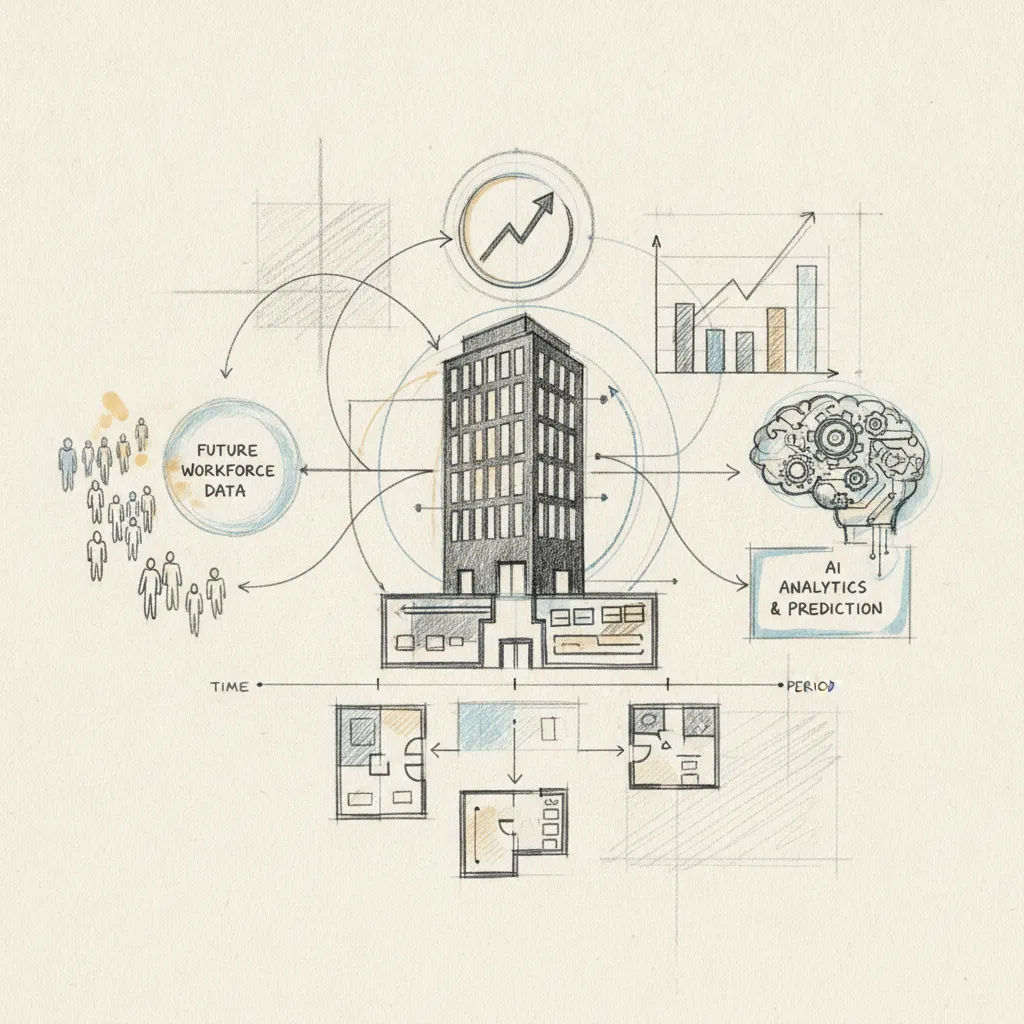
Workspace demand forecasting predicts how much office space your organization will need, by location, day, and team, using occupancy data, booking patterns, and workforce signals rather than static headcount ratios. Unlike traditional planning, which assigns desks based on org-chart size, demand-based forecasting accounts for hybrid attendance variability, achieving up to 97% accuracy. The result: real estate portfolios sized to actual usage, with documented savings of 40% or more on space costs.
Predicting future office space needs replaces fixed desk-per-employee ratios with projections built from real occupancy signals, badge swipes, desk bookings, and calendar data. According to VantageSpace's demand forecasting glossary, effective space forecasting integrates multiple data streams to produce actionable capacity projections.
Traditional headcount planning assumes a static relationship between employees and desks: one person, one seat, or a fixed ratio like 0.8 desks per employee. That model ignores the single most important variable in a hybrid office, actual attendance. On any given day, 30–40% of desks in a conventionally planned office sit empty [3], because the plan was built on payroll counts, not observed behavior.
Demand-based planning asks a different question entirely: not "how many people are on payroll?" but "how many people will be in which space on which day?" That is a probabilistic question, not a static one. It requires time-series occupancy data, team scheduling patterns, and behavioral signals, not an org chart.
The distinction matters most at lease renewal. A 20% headcount increase in a hybrid organization may require zero additional square footage if attendance patterns hold steady. Conflating headcount growth with space demand growth is the most common and costly mistake in corporate real estate planning [3].
Organizations that shift to demand-based planning report real estate spend reductions of 40% or more, with AI-assisted models reaching 97% attendance forecast accuracy. Upflex customers, for example, document both benchmarks, 40%+ reductions in real estate spend and 88% co-attendance achievement, by feeding desk booking data and workforce scheduling signals into the platform's UnifyAI forecasting engine.
Those numbers reflect a structural change: when you know which floors will be at 90% capacity on Wednesday and which will be at 30% on Monday, you can consolidate leases, sublease underused floors, or exit locations entirely, with data to defend every decision to the CFO.
"The organizations that win at real estate optimization are those that treat occupancy data as a strategic asset, not an operational afterthought. Forecasting demand at the team and day level is what separates defensible lease decisions from expensive guesses." — CoreNet Global Research Team, CoreNet Global
The most frequent mistake is treating headcount growth as a direct proxy for space demand. A team that grows from 50 to 60 people under a hybrid policy may peak at 35 in-office on any given day, the same peak it had before hiring [3].
A second pitfall is relying on a single data source. Badge entry counts tell you how many people entered a building; they don't tell you which floors, which desks, or which meeting rooms they used. Accurate space demand prediction requires layered inputs, bookings, sensor data, calendar integrations, cross-referenced to surface real utilization patterns rather than building-level headcounts [1].
Office space forecasting draws on four distinct types and at least five proven methods, each suited to a different planning horizon and data environment. As detailed in VergeSense's guide to building a supply and demand model for office space, combining quantitative and qualitative approaches produces the most reliable results.
Passive forecasting uses historical occupancy data, badge records, sensor readings, desk booking logs, to identify recurring patterns like the Tuesday–Thursday midweek peak that most hybrid offices share [3]. It requires no employee input and works well when policies have been stable long enough to generate a reliable baseline.
Active forecasting pulls in employee intent signals: scheduling submissions, desk reservations, and team calendar data. These inputs capture planned behavior rather than past behavior, which matters when your workforce is shifting how it uses the office.
Short-range forecasting covers weekly and monthly capacity planning, answering questions like how many desks to open next Tuesday or whether a floor can be closed for the next four weeks without impacting teams.
Long-range forecasting operates at the multi-year portfolio level. It informs lease renewal decisions, consolidation strategies, and headcount-driven space projections that corporate real estate leaders need 18–36 months ahead [3].
Most organizations need a blended approach. Quantitative models set the statistical baseline; qualitative inputs adjust that baseline for known disruptions like M&A activity or office relocations that no algorithm can anticipate on its own. According to Manhattan Associates' demand forecasting research, organizations that blend statistical modeling with expert judgment consistently outperform those relying on a single method.

Hybrid work is the single biggest variable in modern office capacity planning because attendance is no longer deterministic, it follows a probability distribution, not a fixed rate. For more information, see Katech.
Legacy space models assumed a predictable headcount multiplied by an assumed occupancy rate. A 3-2 hybrid policy breaks that assumption immediately. In practice, a nominal 60% occupancy target produces actual daily attendance that swings 25–35 percentage points week to week, depending on team schedules, meeting loads, and individual choice [3]. Monday and Friday attendance routinely drops to 20–30% of capacity while Wednesday peaks above 80%.
Start by segmenting your workforce into role archetypes: employees with anchor days required by their manager, fully flexible workers who choose when to come in, and remote-first employees who appear on-site only occasionally. Each segment carries a different attendance probability distribution, not a single number.
Assign a weekly attendance probability curve to each segment. Then aggregate those curves across your portfolio to produce a demand range, a floor, a median, and a peak, rather than a single occupancy figure. That range is what drives defensible real estate decisions.
Return-to-office policy changes are a forecasting disruption event in their own right. Any RTO mandate shift requires re-baselining your model with at least 8–12 weeks of post-policy occupancy data before the forecast stabilizes enough to act on [3].
Organizations that added hybrid-adjusted attendance modeling to their forecasts reduced space over-provisioning by an average of 28% compared to headcount-ratio baselines, according to real estate benchmarking studies [3]. That gap represents real lease liability carried unnecessarily.
Co-attendance modeling adds a coordination layer on top of raw demand forecasting, it ensures specific teams overlap on the same days rather than simply filling desks. Platforms like Upflex achieve 88% co-attendance rates by running scheduling intelligence on top of attendance probability data, demonstrating that coordination at this precision is achievable with the right tooling.
Workspace demand forecasting follows a five-step sequence: audit your data, clean 12–24 months of history, calibrate a model, integrate outputs, and review monthly.
Start by auditing every data source you already have, badge readers, desk booking logs, calendar systems, and HR headcount feeds. Each one captures a different signal, and gaps at this stage compound into unreliable forecasts later.
Before building any model, clean and normalize your historical occupancy data. Twelve to 24 months gives you enough range to capture seasonal patterns and policy shifts; anything shorter risks treating a summer lull as a structural trend.
Step three is model selection and calibration. The right model depends on your hybrid policy, a three-days-in mandate produces different demand curves than a fully flexible arrangement, and your model parameters need to reflect that reality from the start.
Minimum viable data set: at least six months of daily occupancy records at the floor or zone level, segmented by department [3]. Below that threshold, the statistical base is too thin to separate signal from noise.
Step four is connecting forecast outputs to your planning tools. Step five is establishing a monthly review cadence, a standing meeting where the forecast drives an actual portfolio decision, not just a status update.
Most enterprise CAFM and IWMS platforms, Archibus, Planon, and FM:Systems among them, accept occupancy data via API or flat-file import. The forecast output should feed directly into each platform's space allocation module so scenario planning runs from live projections, not static headcount assumptions.
Upflex's UnifyAI engine is built for exactly this kind of integration: it processes attendance and booking data, outputs attendance forecasts at 97% accuracy, and surfaces those projections in a single dashboard that connects to existing workplace systems. That means your CAFM platform receives updated demand signals automatically rather than waiting for a quarterly data export.
A demand forecast only earns its value when it changes a physical or policy decision [3]. If your model shows Tuesday–Thursday peaks at 72% utilization and Monday/Friday troughs at 28%, the correct design response is a neighborhood-based layout provisioned at 70–75 desks per 100 employees, not a 1:1 desk-to-headcount ratio that leaves 25–30% of your floor empty at peak and overloaded on paper the rest of the week.
Governance determines whether any of this happens. The forecast needs a named owner, typically the Head of Real Estate or Workplace Strategy, with actual authority to act on the outputs. Without that accountability, even a well-calibrated model produces reports that sit unread while lease decisions get made on gut feel.
Three tool categories cover most enterprise needs for predicting office space requirements, and the right choice depends on your existing stack, data maturity, and how fast you need production-ready accuracy.
The market splits into three distinct categories. First, standalone workplace analytics platforms, such as Density, Hana, or SpaceIQ, offer built-in forecasting engines designed specifically around occupancy data. Second, IWMS and CAFM platforms (Archibus, Planon, FM:Systems) provide forecasting as a bolted-on module to a broader facilities management suite. Third, AI-native workplace management platforms combine desk booking, occupancy sensing, and predictive forecasting in a single system, Upflex's UnifyAI engine, for example, forecasts office attendance with 97% accuracy by processing scheduling inputs and utilization data together rather than treating them as separate data streams.
Most buyers evaluate on feature breadth and miss three criteria that determine real-world accuracy. Model explainability, whether the system can show why it predicted a specific demand level, matters when you need to defend a lease decision to a CFO. Re-baselining speed after a policy change (a return-to-office mandate, for instance) determines how quickly forecasts recover their accuracy. The ability to model co-attendance, not just raw headcount presence, is the difference between knowing 60 people will be in the building and knowing whether Team A will actually overlap with Team B on Thursday [3].
On the build-vs-buy question: organizations with strong data science teams do build custom models in Python or R on top of raw sensor data. Off-the-shelf platforms, though, typically reach production accuracy 6–9 months faster, a meaningful gap when a lease renewal is on the table.
Five features should be non-negotiable in any vendor evaluation:
Run every shortlisted vendor through this integration checklist: does the tool connect to your badge/access control system, your desk booking platform, your HRIS, and your CAFM via certified API, or does it rely on manual data exports? Manual exports introduce lag and human error that compound over time, quietly degrading forecast quality.
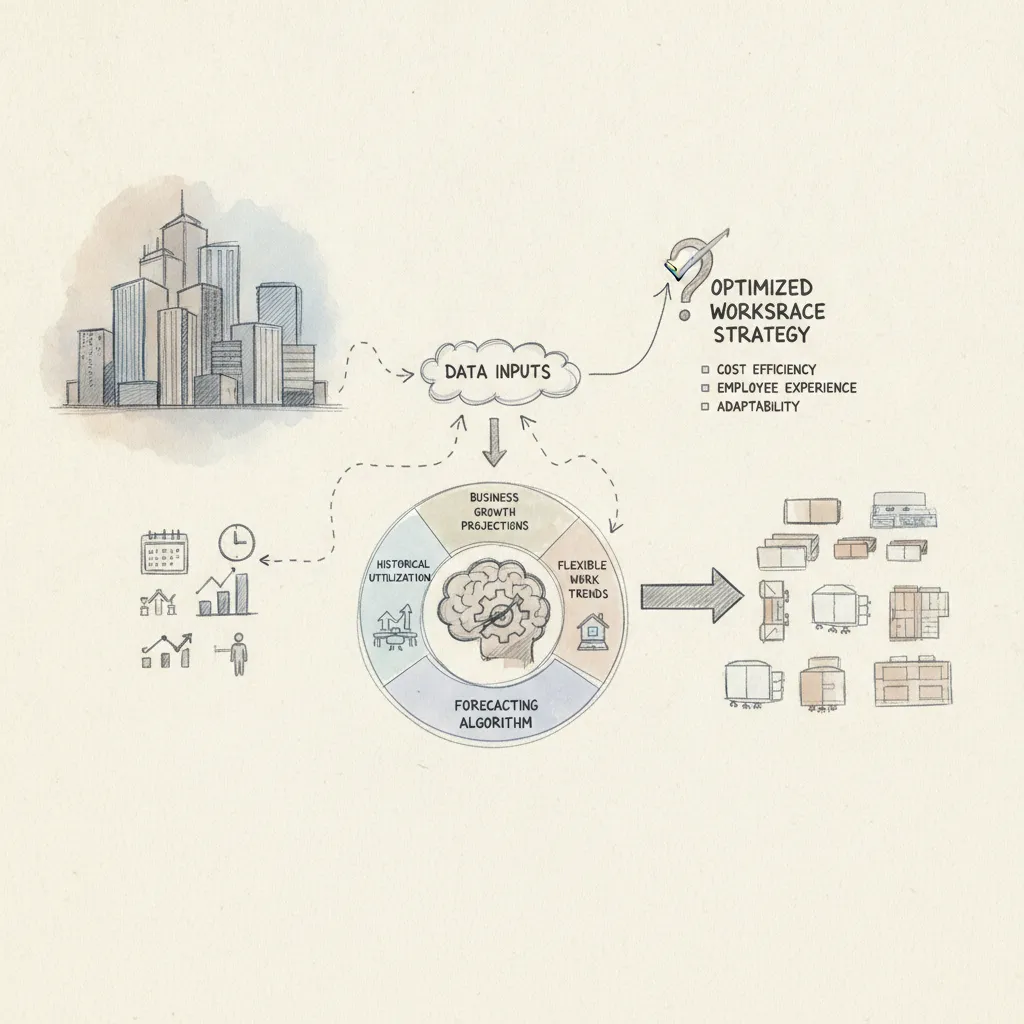
Most forecasting models need at least three to six months of consistent occupancy data to surface reliable patterns. Shorter windows miss seasonal shifts, a summer lull or a Q4 all-hands spike, that distort baseline demand. Badge access logs, desk booking records, and Wi-Fi sensor data all count toward this baseline. If your data is sparse, start collecting now and run preliminary forecasts at 90 days, refining the model as more signal accumulates.
Space utilization tracking measures what happened; demand forecasting projects what will happen [1]. Utilization tells you that 42% of desks were occupied last Tuesday. Forecasting takes that history, layers in team schedules, headcount plans, and behavioral signals, then estimates how many desks you'll need three months from now. Both matter, but only forecasting gives you the lead time to act on a lease decision, a floor consolidation, or a hiring plan before the cost is already locked in.
Run a full forecast refresh at least quarterly, with lighter rolling updates monthly. Significant business events, a new return-to-office policy, a large hiring cohort, or a site closure, should trigger an immediate re-run regardless of schedule. Hybrid attendance patterns shift faster than annual planning cycles assume [3], so forecasts that go stale for six months routinely misrepresent actual demand by the time a decision lands.
Mid-sized companies with 200 or more employees across multiple locations benefit meaningfully from workspace demand forecasting. Real estate is typically a top-three operating cost at that scale, and even a single poorly-timed lease renewal on an oversized floor can cost hundreds of thousands of dollars. The data requirements are also lower, a smaller portfolio produces cleaner signals with less noise. Enterprise platforms like Upflex are built for global scale, but the underlying forecasting logic applies wherever occupancy is unpredictable and space costs are material.
Organizations should anonymize individual-level data at the point of collection, aggregating signals by team, floor, or zone rather than tracking specific employees. Most enterprise platforms comply with GDPR and CCPA requirements by design. According to the U.S. General Services Administration's workspace utilization guidelines, best practice is to use aggregated occupancy metrics rather than personally identifiable location data. Establishing a clear data governance policy before deployment protects employee trust and ensures regulatory compliance.
Workspace demand forecasting shifts real estate decisions from assumption to evidence. Three things are worth acting on immediately: first, audit the occupancy data you're already collecting, badge logs, booking records, sensor feeds, and identify gaps before you try to build a forecast. Second, separate your peak-day demand from your average, because sizing a portfolio to the mean guarantees you're either over-leased or under-resourced on the days that matter. Third, connect your forecast directly to lease decision timelines so the data is ready before the renewal deadline, not after.
If you want to see how AI-driven attendance forecasting translates into a concrete reduction in real estate spend, request a demo from Upflex and bring your current utilization numbers to the conversation.
Explore more from our content library: