Share This Article
No items found.

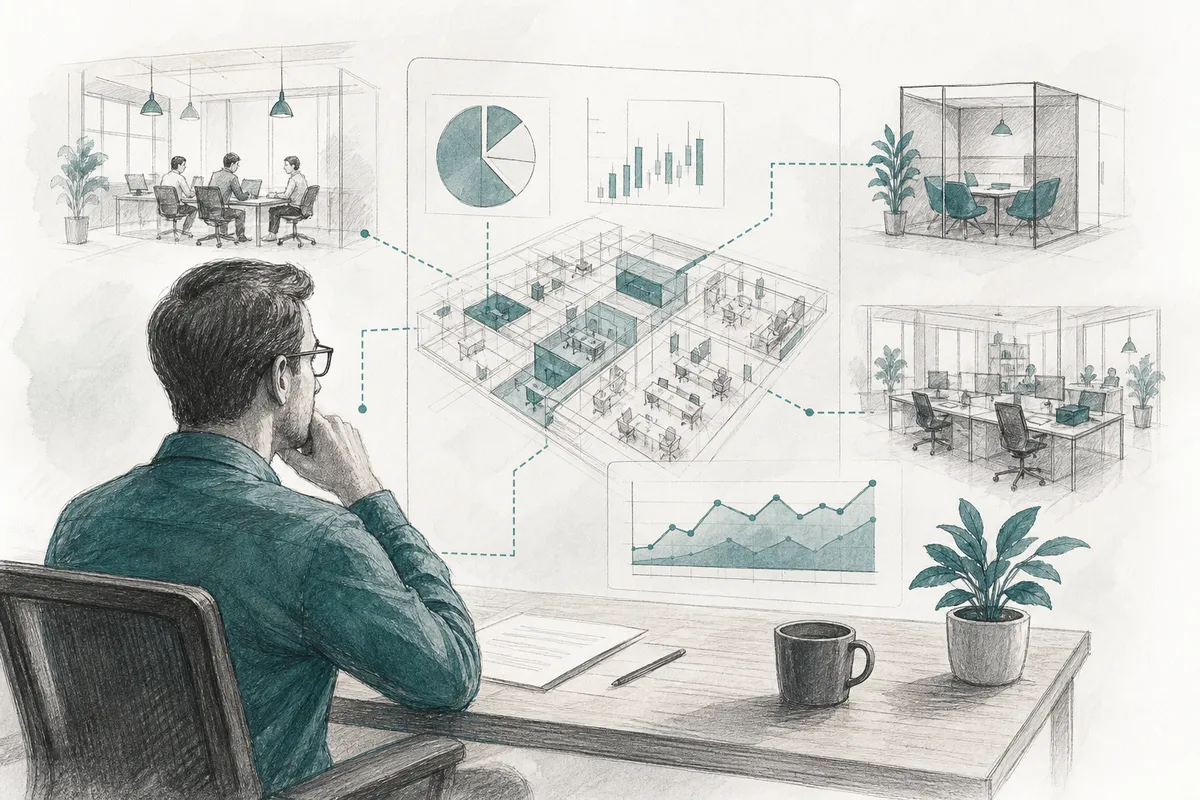
Workplace cost transparency means giving CFOs and real estate leaders real-time visibility into what hybrid work actually costs, by location, team, and space type, so spending decisions are based on data instead of legacy leases or guesswork. It matters because most organizations still pay for office space sized around outdated headcount assumptions rather than actual attendance patterns. Real transparency connects utilization data, booking patterns, and facility costs into one view, which is the precondition for cutting real estate spend and justifying whatever space you keep.
You get workplace cost transparency by pulling cost data out of the systems that trap it and putting lease, badge, booking, and expense records into one comparable view. Most companies never do this, which is why real estate spend keeps drifting from what leadership actually approved.
Four cost categories tend to hide in plain sight because no single team owns all of them. Underused leased square footage is the biggest one, a floor signed for a headcount that no longer shows up five days a week keeps generating rent, taxes, and insurance regardless of who's sitting in it.
Duplicate spend is the second: paying for a fixed office lease in a city while also paying for on-demand desks a few blocks away for employees who never learned the office existed. Third, facilities and utilities costs scale with square footage, not attendance, a half-empty building still needs full HVAC, cleaning, and security. Fourth, admin overhead climbs quietly as a company manages more location contracts, each with its own renewal date, vendor, and invoice format.
You integrate this data by normalizing cost-per-location and cost-per-booking into one layer that sits above the source systems, rather than trying to force lease administration, access control, and booking tools to talk to each other directly. That fragmentation is the default state: lease admin software tracks rent obligations, badge or access-control systems track who actually enters a building, desk booking tools track reservations that may or may not match real attendance, and expense reports capture on-demand workspace charges somewhere else entirely. None of these systems were built to reconcile with each other. Upflex approaches this by feeding scheduling inputs and utilization data through its UnifyAI engine, which forecasts attendance with 97% accuracy and outputs a consolidated view of real estate usage across both owned offices and the on-demand workspace network. That consolidation is what turns scattered records into a decision-ready picture instead of four disconnected reports.
A concrete blind spot shows why this matters: a satellite office running at 20% badge-in occupancy while the same company pays recurring on-demand workspace fees for employees working a few miles away. Without a unified layer, the real estate team sees the lease cost, finance sees the on-demand invoice, and nobody sees both line items together, so the obvious fix, consolidating into one space, never surfaces as an option.
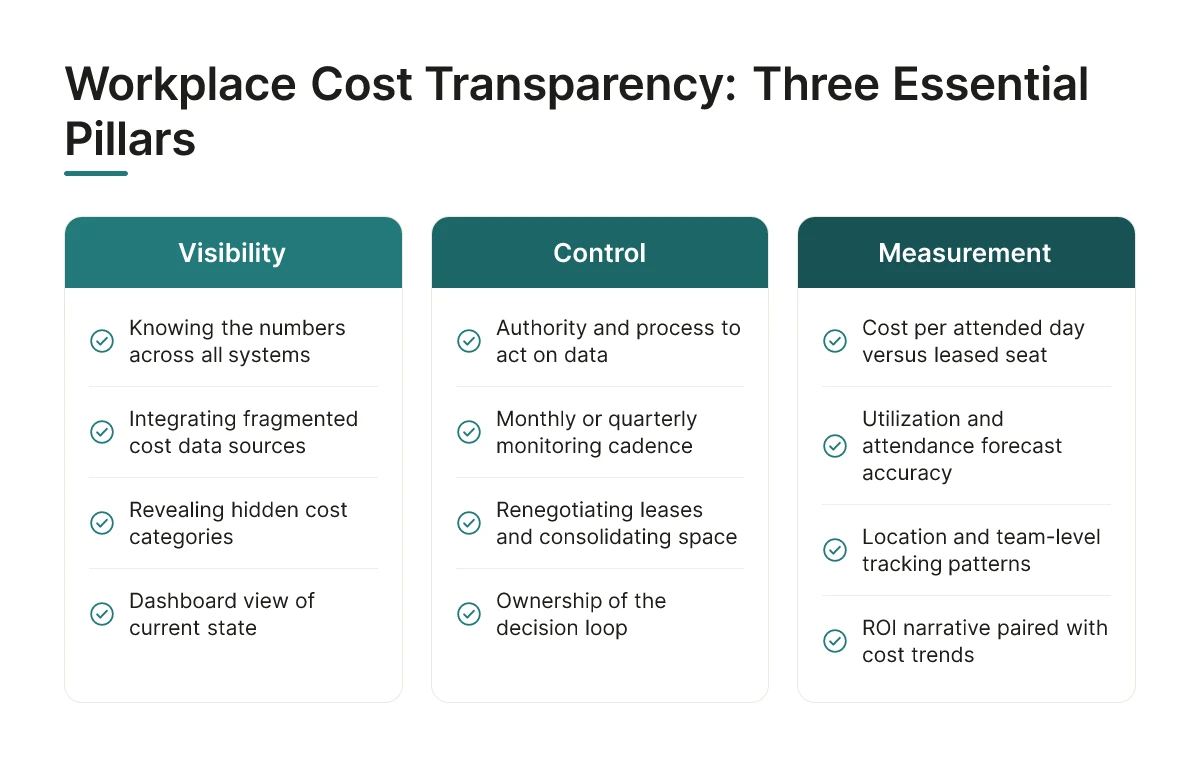
Visibility means knowing what a desk, a floor, or a lease actually costs. Control means having the authority, process, and schedule to change that number, renegotiate the lease, consolidate the floor, move the team.
Most enterprises have plenty of the first and very little of the second. A utilization dashboard can show that a floor sits at 30% capacity three days a week, but that fact alone doesn't cancel a lease or move a team. Workplace cost transparency only pays off once someone with real budget authority is watching the same numbers as the person who can act on them.
The data and the authority to act on it usually live in different departments. Corporate real estate teams track badge swipes, desk bookings, and square footage; finance owns the budget line and the sign-off on any lease change or headcount shift.
Neither side owns the full decision loop. Real estate can flag an underused building, but without finance's buy-in nothing moves, and finance rarely sees utilization data granular enough to challenge a renewal on its own. The report gets built, gets reviewed, and gets shelved until the next lease deadline forces a conversation.
Three structural issues show up repeatedly.
The gap tends to show up most clearly in cadence. An annual real estate review catches problems a year too late, by the time it happens, the underused floor has cost a full budget cycle in wasted rent. A monthly or quarterly monitoring rhythm, by contrast, flags declining attendance while there's still time to consolidate, renegotiate, or reallocate space before the next lease decision comes due.
You justify office space ROI by pairing a cost line with a utilization line, so leadership sees spend and actual usage move together, not spend in isolation. Headcount alone can't do this job anymore, a lease sized for 500 badge-holders means little if only 180 people show up on a given Tuesday. Workplace cost transparency starts with connecting what you spend to what actually gets used.
Three metrics do most of the work in a finance-credible ROI case. Track attendance forecast accuracy against actual turnout, because a plan built on wrong assumptions produces wrong spending decisions regardless of how good the space itself is. Track cost per attended day versus cost per leased seat, the gap between those two numbers is usually where the wasted spend hides. Track space cost trend relative to team growth, since a headcount increase doesn't automatically justify a proportional real estate increase if attendance patterns stay flat.
Upflex's UnifyAI engine forecasts attendance at 97% accuracy, which turns the first metric from a rough estimate into a number finance can actually rely on. When forecast accuracy is high, cost-per-attended-day and utilization figures stop being educated guesses and start functioning as planning inputs.
True cost per employee is total space spend divided by attendance-adjusted headcount, not the number of people on payroll or badges issued. Add leased or on-demand space cost, facilities expense, and services cost into one number, then divide by the average number of people actually showing up, not the number technically assigned a desk. A team of 200 with 40% average attendance is costing you space for roughly 80 people, and pricing decisions should reflect that, not the roster count.
This distinction matters because badge-issued headcount inflates the denominator and hides the real cost per person using the space. Real estate leaders who report cost per employee using payroll headcount routinely understate the actual efficiency problem, because the number looks stable even as attendance drifts lower.
Present cost and utilization as a ratio, not two separate line items on different slides. A cost trend climbing 8% while utilization holds flat tells a very different story than a cost trend climbing 8% alongside 15% attendance growth, the first is a red flag, the second is a demand signal. Chief financial officers respond to ratios because ratios show direction, not just magnitude.
The common mistake is anchoring the case to an occupancy target, "we hit 70% utilization", instead of a cost outcome. Occupancy percentages don't mean anything to a CFO without a dollar figure attached; pairing occupancy with cost per attended day converts a workplace metric into a finance metric, which is what gets budget approved.
Three data buckets drive workplace cost transparency: fixed real estate cost, variable workspace cost, and utilization data, and none of them means much without the others.
Fixed real estate cost covers lease payments, property tax, and facilities overhead, the numbers already on the balance sheet. Variable workspace cost covers on-demand bookings, day passes, and any spend tied to flexible access rather than a signed lease. Utilization data, attendance, desk and room booking activity, no-show rate, is the connective layer that explains why the first two numbers look the way they do. Most finance teams already track the first bucket closely. Fewer track the third with enough granularity to act on it.
Low, consistent utilization on a floor or in a specific location is the clearest signal that space is a candidate for consolidation or lease renegotiation.
A floor running at 25-30% occupancy on a normal week isn't a scheduling problem, it's a capacity problem, and it's one finance can act on. The challenge is separating a genuinely underused floor from one that's simply booked inconsistently because teams lack visibility into who's coming in. This is where attendance forecasting earns its keep: Upflex's UnifyAI engine predicts attendance with 97% accuracy, which gives real estate leaders a defensible utilization baseline instead of a guess based on badge swipes from three months ago. Without that baseline, a lease renewal decision is a bet. With it, it's a calculation.
Booking patterns expose a mismatch most companies never quantify: peak-day bookings spike while cleaning, security, and utility costs stay fixed every day of the week.
An office might see 80% desk bookings on Tuesday and 15% on Friday, but janitorial contracts, security staffing, and HVAC run on a flat schedule regardless of who shows up. That gap between when people actually use the space and when the company pays full facility cost for it is one of the more overlooked line items in a hybrid budget. Tracking booking patterns alongside facility invoices makes that gap visible instead of buried in a monthly services bill.
None of this works if it's measured only at the company level. Hybrid usage patterns vary sharply by office and by team, a sales floor in Chicago and an engineering floor in Austin rarely follow the same rhythm. CFOs and real estate leaders need utilization, booking, and facility cost data broken out by location and by team, not blended into a single company-wide average that hides where the real savings sit.
Savings come from a fixed sequence: baseline your current cost and utilization data, rank locations by cost-per-desk against actual usage, model consolidation scenarios, then track results against that baseline every month.
Skipping steps is where most real estate initiatives stall. A CFO who asks "how much did we save" six months into a consolidation needs a number that traces back to a documented starting point, not a rough estimate from the original business case. Workplace cost transparency only pays off when the baseline is specific enough to survive that question.
The three recurring obstacles are desk loss, manager pushback on relocations, and the lease approval chain, each needs a specific answer before rollout, not after complaints start.
Integration means syncing headcount from your HRIS and fixed-cost data from your lease or real estate system so all three sources agree on the same numbers.
Utilization data means little if headcount is stale, a location showing 40% utilization against last year's headcount could be near capacity against this year's actual team size. Syncing with the HRIS keeps the denominator accurate. On the cost side, lease terms, renewal dates, and per-square-foot rates need to flow from the real estate or lease management system directly, rather than being re-entered manually, so the savings figure reported to the CFO reconciles with what finance already has on the books. Upflex's office orchestration dashboard is built around this reconciliation, unifying booking, attendance forecasting, and utilization data in one place so the numbers behind a consolidation decision don't contradict each other across departments.
Roll out changes on one or two locations first. A pilot generates real observed numbers, actual attendance, actual cost per desk, actual employee reaction, that make the case for a wider rollout far more convincingly than projections ever will.

Ownership sits jointly with Corporate Real Estate and Finance, with HR as a required partner, not a passive stakeholder. Real estate leaders bring utilization and lease data, Finance validates the cost model, and HR ensures decisions account for employee experience and co-attendance goals. Splitting ownership across three functions is common, but one leader should be accountable for the final numbers presented to the CFO.
Monthly reviews work best for most hybrid portfolios, with a deeper quarterly analysis tied to lease and budget cycles. Attendance patterns shift with seasons, hiring, and policy changes, so quarterly-only reviews risk missing trends that would justify faster action on underused space.
Yes, remote teams still carry cost implications worth tracking, even without a dedicated desk. Remote employees may use on-demand workspace networks, coworking stipends, or occasional office visits, all of which show up as real estate or facilities spend. Ignoring remote-only headcount in cost models understates total workplace spend and skews portfolio decisions.
Start by pulling badge-swipe or desk-booking data alongside your current lease and facilities costs into one spreadsheet. Even a rough utilization-versus-cost comparison for your largest office reveals obvious gaps, like a floor running at 30% capacity while carrying full lease cost. That single comparison usually builds the case for investing in better forecasting tools before you tackle the full portfolio.
Workplace cost transparency comes down to connecting three data sets that usually live in different departments: real estate cost, actual attendance, and team coordination goals. Once those numbers sit in one place, decisions about consolidation, lease renewal, and desk ratios stop being guesswork and start being defensible to a CFO. Platforms like Upflex shorten that path by forecasting attendance at 97% accuracy and pairing it with real-time utilization data, giving leaders the evidence needed to right-size a portfolio without breaking hybrid commitments. Start with one underperforming office: pull its utilization and cost data side by side this week, and let that comparison drive your next lease decision.
Explore more from our content library: