Share This Article
No items found.


Workplace real estate benchmarking measures your cost-per-seat, space utilization, and occupancy density against comparable organizations to find where your portfolio is over-spending or under-using space. The comparison only holds value when the peer group matches your industry, headcount, and work model, a fully remote tech firm and a bank branch network have nothing useful to tell each other. Done well, it turns a vague sense of "we probably have too much space" into a ranked list of specific, fundable cost-reduction moves: consolidating underused floors, renegotiating leases, or shifting to flexible workspace.
You measure it by pairing a fixed set of cost and utilization metrics with a peer group narrow enough to make the comparison fair. Get either half wrong, sloppy metrics or a mismatched peer set, and the exercise produces numbers that feel authoritative but point you in the wrong direction.
Six figures form the core of any workplace real estate benchmarking exercise: cost per seat, cost per employee, square footage per person, occupancy or utilization rate, vacancy rate, and lease cost as a share of revenue. Each one answers a different question, cost per seat tells you what a desk costs to provide, square footage per person tells you how densely you've built the office, and lease cost as a share of revenue tells finance leaders whether real estate is growing faster than the business it supports.
Cost per seat is the metric everyone reaches for first, and it's also the one most likely to mislead on its own. A cheap lease with low occupancy can cost more per actual working hour than an expensive office that's full five days a week, you're still paying for the empty desks, you've just lowered the sticker price per square foot. Cost per seat only means something next to a utilization number; report them separately and you'll draw the wrong conclusion nearly every time.
Four filters make a peer comparison valid: industry, company size or headcount, geography, and work model. A 3,000-person insurer in Chicago running a three-day hybrid schedule has almost nothing to learn from a 200-person fully remote software startup, even if both call themselves "tech-enabled", the cost structures, space needs, and utilization patterns don't translate.
Watch for a second trap: comparing your numbers against a single average instead of a distribution. An average or median cost-per-seat figure tells you where the middle sits, but it hides the spread around it. Without knowing the range, you can't tell whether you're a mild outlier worth monitoring or three standard deviations off and bleeding cash. Ask for percentile breakdowns, not just a headline number, whenever a benchmark source offers one.
When solid external peer data is thin, which is common outside a few well-studied sectors like financial services and law, internal benchmarking is a legitimate stand-in. Comparing this quarter against last quarter, or one regional office against another inside your own portfolio, still surfaces real gaps in utilization and cost even without an outside reference point.
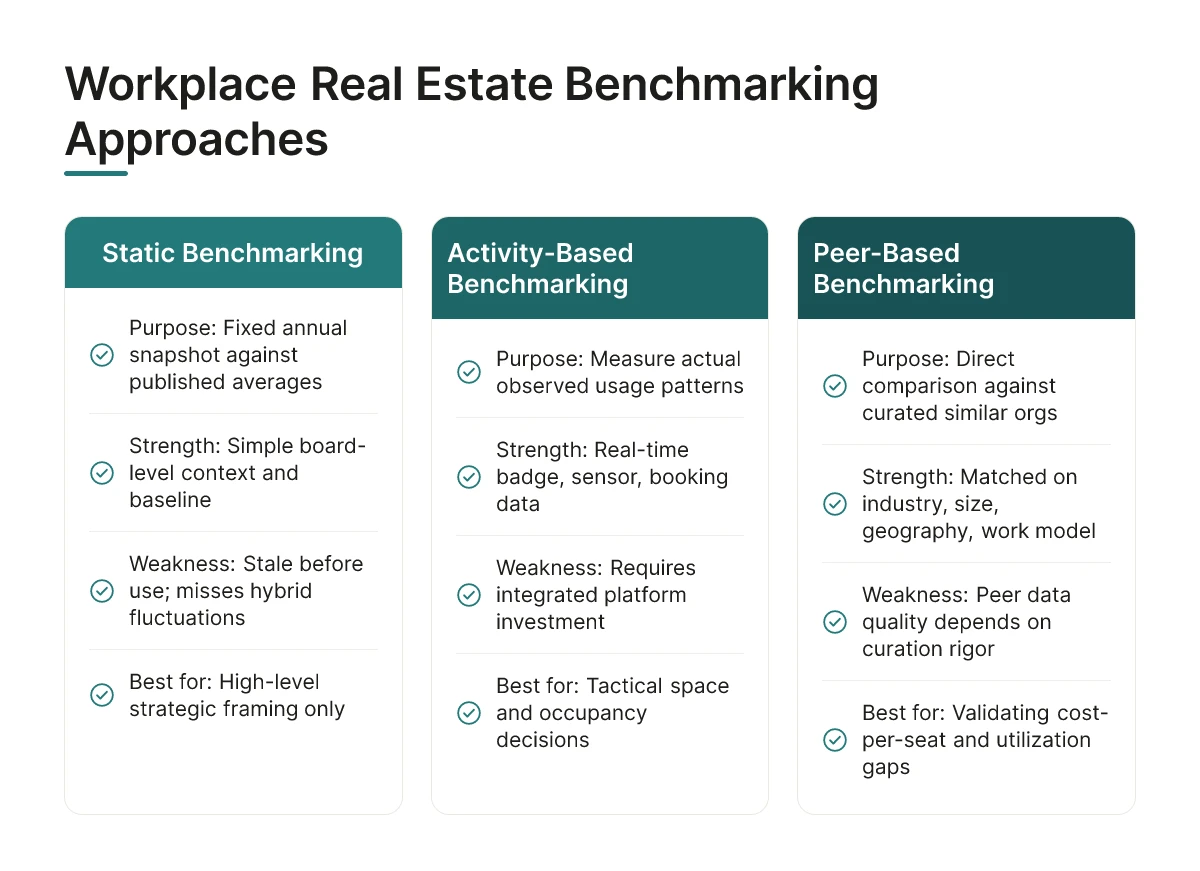
Four methodologies dominate workplace real estate benchmarking today, and each answers a different question, static snapshots ask "how do we compare on paper," activity-based data asks "how is space actually used."
Traditional static benchmarking pulls a fixed set of ratios once a year, square feet per employee, cost per desk, occupancy targets, and compares them against published industry averages. It's fast to run and easy to present to a board. The problem is timing: a static benchmark is a photograph of your portfolio taken on one day, then held up as truth for the next twelve months while the actual workplace keeps changing.
Peer-based benchmarking narrows the comparison set. Instead of measuring against a broad sector average, it matches your organization against a curated group of similarly sized companies in similar industries, geographies, and work models. A 3,000-person insurance firm in Chicago gets compared to other mid-size insurers with hybrid policies, not lumped in with tech companies or manufacturers with fundamentally different space needs.
Activity-based (IBOS-style) benchmarking measures what actually happens in a building, badge swipes, sensor readings, desk booking records, instead of assuming a fixed headcount-to-desk ratio. Where static benchmarking says "we budget one desk per employee," activity-based data says "on our busiest day this quarter, 61% of assigned desks were occupied by 11 a.m." That gap between assumed and observed usage is exactly where most real estate waste hides.
This is also where the static-benchmark trap shows up most clearly. Picture a company that shifted to a three-day hybrid schedule two years ago but still reports utilization against a pre-pandemic ratio built for five-day, fully assigned seating. Every quarter, the static benchmark says the company is "under-provisioned" and needs more desks, while badge and booking data show Tuesdays and Wednesdays running near capacity and Mondays and Fridays sitting nearly empty. The fixed standard is measuring the wrong thing entirely.
Industry-wide benchmarking gives broad context, where does our square-footage-per-employee fall relative to the entire commercial real estate sector, while peer-based benchmarking gives a matched, actionable comparison against organizations that actually resemble yours. CREW Network's 2025 study, based on nearly 2,450 industry professionals surveyed between January and April [1], is a good example of the industry-wide category: valuable for sector-level trend awareness, less useful for deciding whether your specific Denver office should shrink by two floors.
Mature real estate teams don't pick one approach and discard the rest. They use static, industry-wide benchmarks for board-level framing and peer comparisons for competitive context, then rely on activity-based data, the kind platforms like Upflex generate through attendance forecasting and desk booking records, to make the tactical calls: which floor to sublease, which days need more capacity, which team's booking pattern justifies a lease renewal versus an exit.
Static benchmarks fail because they capture one moment in time, while hybrid attendance shifts week to week, the number is outdated before anyone acts on it.
Most workplace real estate benchmarking still runs on an annual cycle: pull a headcount snapshot, measure square footage against it, and set a ratio that guides space decisions for the next twelve months. That approach worked when employees came in five days a week and occupancy was predictable. It breaks down in a hybrid environment where attendance on a Tuesday can run double what it was on a Monday, and where the average across a quarter hides swings that matter more than the mean.
Outdated benchmarks push real estate leaders toward one of two costly mistakes, and both are hard to reverse once locked into a lease.
The first is over-provisioning. A benchmark built on last year's headcount ratio can justify holding onto square footage that utilization data would show is no longer needed. Once that space is signed into a multi-year lease, the cost stays on the books long after actual attendance has dropped, a fixed obligation tracking a number that's no longer true.
The second mistake runs the opposite direction. Some organizations benchmarked toward an assumed permanent drop in office attendance, then downsized based on that projection. When teams came back faster or more consistently than expected, the result was crowded floors, desk shortages on anchor days, and friction that undercuts the collaboration the office was supposed to support.
Benchmarking has to shift from a single annual snapshot to a rolling comparison against near-real-time occupancy data.
Hybrid attendance isn't random, it clusters around anchor days and team-coordinated in-office schedules, which means the meaningful benchmark is the pattern, not the average. A floor that's near capacity on Tuesday and Wednesday but nearly empty on Friday needs a different sizing decision than a flat utilization number would suggest. Comparing actual badge and booking data against a fixed target set a year ago misses that pattern entirely.
The practical fix is cadence. Re-benchmarking on a quarterly basis, or continuously through live utilization feeds, keeps the comparison anchored to current behavior rather than a stale forecast. Platforms like Upflex support this by combining attendance forecasting with actual booking data, giving real estate teams a rolling view of occupancy instead of a once-a-year guess they have to defend for the next four quarters.
Workplace real estate benchmarking runs on four data layers: occupancy sensing, space-management software, lease and cost tracking, and peer-comparison feeds, few tools cover all four well.
Start with the raw data layer: occupancy sensors and badge-data integration that capture who is actually in the building, not just who booked a desk. Layer on a space-management dashboard that turns that raw data into utilization rates by floor, team, and building.
You also need lease-cost tracking that ties square footage to what you actually pay per location, so utilization numbers connect to real dollars rather than sitting in a separate spreadsheet. Last, look for peer-comparison data feeds, external benchmarks that tell you whether your 45% utilization rate is normal for your industry and office type or a red flag.
Miss any one of these four layers and the benchmarking exercise turns into a partial picture: accurate on cost but blind on usage, or rich in sensor data with no way to compare it against anyone else.
AI-forecasting platforms improve accuracy by recognizing patterns across booking behavior and badge data to predict future attendance, rather than assuming next month looks like last month's average.
A static average smooths over the variation that actually matters, the fact that Tuesdays and Wednesdays run heavy while Mondays and Fridays run light, or that one team clusters attendance around sprint deadlines. Upflex's UnifyAI engine, for example, processes scheduling inputs and utilization data to forecast attendance with 97% accuracy, which gives real estate leaders a benchmark grounded in what teams will actually do rather than what they did six months ago.
Tools in this category split into two types. Point solutions handle one job, a sensor system that counts bodies, or a booking tool that manages desk reservations, and they work fine as a starting point but leave you stitching data together manually. Integrated workplace-orchestration platforms combine forecasting, booking, and cost data in a single view, which matters once you're trying to make a portfolio-wide consolidation decision rather than a single-floor adjustment.
Cost tiers track that same split. Budget-friendly benchmarking still happens through manual, spreadsheet-based tracking of badge exports and lease terms, workable for a single building, painful past a handful of sites. Mid-range point tools add sensor hardware or booking software without the forecasting or portfolio-wide view. Premium and enterprise integrated platforms bundle attendance forecasting, booking, and cost data together, priced for organizations managing multiple locations where the cost of a bad consolidation call outweighs the software spend.
One more factor changes the benchmark itself: access to an on-demand workspace network. When employees can book third-party space instead of a fixed desk, part of your real estate cost shifts from fixed to variable, which means the benchmark you're measuring against needs to account for flexible capacity, not just owned square footage.
Turning workplace real estate benchmarking into funded decisions requires a defined process: gather data, compare against peers, rank outliers by savings potential, then build a business case finance will approve.
Start by pulling utilization data and cost data for every location, badge swipes or sensor readings alongside lease cost, operating expense, and headcount per site. Next, select a peer group: comparable office markets, similar industry, similar workforce structure, so the comparison isn't distorted by geography or business model differences.
Run the comparison to produce cost-per-seat and utilization-rate figures for each site, then flag outlier locations, offices where cost-per-seat sits well above the peer median while utilization sits well below it. Those are your candidates for action.
The prioritization step is where most benchmarking exercises break down. The instinct is to attack the largest office first because it looks like the biggest opportunity. A better method ranks locations by a combined score: cost-per-seat gap multiplied by utilization gap, weighted by how easy the location is to act on given lease terms and remaining commitment length. A mid-size satellite office three months from lease expiration often outranks a flagship headquarters locked into a ten-year term, even though the headquarters has more square footage on paper.
From there, benchmarking typically surfaces four levers: consolidating underused floors into a smaller footprint, renegotiating or exiting leases at renewal rather than auto-renewing, converting fixed desk assignments to flexible or on-demand workspace for teams with low in-office frequency, and right-sizing satellite offices that were built for headcount projections that never materialized.
Present findings to finance in the language budget owners already use, cost-per-seat trend lines and utilization trend lines, not raw square footage totals. A chart showing cost-per-seat climbing while utilization declines over several quarters makes the case for action more clearly than a floor plan ever will, because it maps directly to the P&L line finance is watching.
A realistic outcome looks like this: total footprint shrinks, a portion of fixed lease cost converts into variable spend tied to actual usage, and the ratio of space to headcount improves because the remaining square footage is matched to real attendance patterns rather than historical headcount peaks. Platforms like Upflex support this shift directly, attendance forecasting identifies which days and locations are genuinely under-demanded, desk booking data confirms it, and access to an on-demand workspace network lets you shed fixed space without stranding employees who still need somewhere to work. That combination is what turns a benchmarking report from a slide deck into a funded real estate decision.

Re-run workplace real estate benchmarking twice a year, with a lighter monthly check on utilization trends. Hybrid attendance patterns shift with seasons, org changes, and policy updates, so a benchmark done in January can look outdated by summer. Companies approaching a lease decision should benchmark quarterly until the decision closes.
Yes, though the metrics shift from attendance forecasting to space efficiency and cost per employee. Fully in-office companies still benefit from comparing square footage per head, desk-to-employee ratios, and lease cost per square foot against peers to catch overspending.
Most hybrid organizations target 60-75% utilization on peak in-office days, with lower averages across the full week. Chasing 100% utilization usually backfires, it leaves no buffer for growth or day-to-day fluctuation. The more useful benchmark is often co-attendance: whether teams that need to collaborate in person are actually showing up on the same days, not just whether desks are full.
Yes, a small company can benchmark manually using badge data, calendar records, and public cost-per-square-foot data from local commercial real estate reports. It takes more manual effort and won't scale past a few dozen employees, but it's a reasonable starting point before investing in a dedicated platform.
Workplace real estate benchmarking only pays off when it's tied to a decision, a lease renewal, a downsizing plan, or a policy change. Compare utilization and cost against both external industry data and your own historical baseline, and treat co-attendance, not raw occupancy, as the metric that actually predicts whether an office is working.
Static, once-a-year benchmarking misses the swings that hybrid schedules create week to week. Start by pulling your last two quarters of badge or booking data and mapping it against your current lease costs, that single comparison usually reveals whether you're overpaying for space nobody's using.
Explore more from our content library: