Share This Article
No items found.


Workspace data real estate means using occupancy, utilization, and booking data to make smarter decisions about your physical office portfolio, cutting costs, right-sizing space, and proving ROI with numbers instead of gut feel. Companies that act on this data typically reduce real estate spend by 40% or more. The steps below show exactly how to audit your current data, choose the right software, and measure results.
Start by cataloging every system generating space data before touching a single software contract or portfolio decision.
Most corporate real estate teams discover they already hold three categories of workspace data: badge access logs, desk and room booking records, and IoT sensor feeds. Each tells a different part of the story, and each carries accuracy trade-offs that matter when you're making portfolio-level calls.
IoT occupancy sensors capture actual physical presence in real time, making them the most accurate source in a workspace data real estate audit. The cost is the catch: devices run $150–$400 per unit, so instrumenting a 200-desk floor can require a $30,000–$80,000 hardware investment before any software is factored in.
Desk and room booking data costs nothing extra if you're already running a calendar platform or IWMS, but it overstates actual occupancy by 20–30% because employees book space and don't show up. Badge access logs confirm that someone entered the building, but they don't tell you which desk they used or how long they stayed.
The practical approach: use badge data to establish arrival patterns, booking data to map intended utilization, and sensors selectively on high-value floors where precision justifies the hardware spend.
"The most effective workspace strategies combine multiple data streams — badge, sensor, and booking — because each source alone tells an incomplete story. Only when you triangulate across all three do you get the confidence to make irreversible portfolio decisions." — Dr. Michael Joroff, Senior Lecturer, MIT School of Architecture and Planning
The output of this audit step is a one-page heatmap showing utilization by floor, day of week, and time block, the baseline every post-implementation ROI calculation references.
According to JLL's workspace research, organizations that unify their occupancy data sources before making portfolio decisions consistently achieve faster and larger cost reductions than those relying on a single data stream. Platforms like Upflex ingest these fragmented data feeds through its UnifyAI engine, unifying booking, badge, and sensor inputs into a single occupancy view, the same view that supports its 97% attendance forecast accuracy. But the heatmap itself costs nothing to build and gives you the evidence base to justify any tool purchase that follows.
The right workspace data real estate platform depends on three factors: how deep it integrates with your existing systems, what it costs per seat, and which CRE workflows it actually covers.
CRE software breaks into three categories, each with a different cost structure and scope. Full IWMS suites, IBM TRIRIGA, Planon, run $50,000–$200,000+ annually and cover lease administration, capital projects, and facilities management in one system. Mid-market platforms like WorkSpace and Upflex offer modular pricing starting around $5–$15 per seat per month, targeting teams that need attendance forecasting, desk booking, and portfolio reporting without a year-long implementation. Point solutions (desk booking only, visitor management only) cost less upfront but create integration debt: every disconnected tool adds a manual data reconciliation step that erodes the accuracy of your utilization reporting.
Most published content skips a direct pricing comparison. Use this scoring matrix to rank your shortlist before signing anything:
| Criterion | Weight | Score each platform 1–5 |
|---|---|---|
| ERP/legacy integration depth | 30% | |
| Reporting depth (ASC 842 / IFRS 16) | 25% | |
| Cost per seat | 20% | |
| Implementation speed | 15% | |
| Mobile accessibility | 10% |
Five criteria separate a defensible shortlist from a regrettable multi-year contract. First, ERP integration: most enterprise real estate teams run SAP, Oracle, or JD Edwards. Platforms without pre-built connectors add 3–6 months of custom integration work and $40,000–$120,000 in IT costs, the most underestimated line item in any CRE software budget. Second, real-time API availability, so occupancy data flows to finance dashboards without overnight batch jobs. Third, role-based dashboards that give portfolio managers lease-level views while facilities teams see floor-level booking data. Fourth, audit-ready reporting that meets ASC 842 and IFRS 16 lease accounting standards. Fifth, mobile accessibility for hybrid workers who book desks from a phone on the way in.
The IFRS Foundation's guidance on IFRS 16 lease accounting makes clear that organizations must maintain accurate, auditable records of right-of-use assets — a requirement that workspace data platforms are increasingly built to support directly.
Run a structured shortlist process: demo three platforms, run a 30-day pilot on one floor, then measure booking accuracy and data completeness before committing. A pilot catches integration gaps that a sales demo never will.
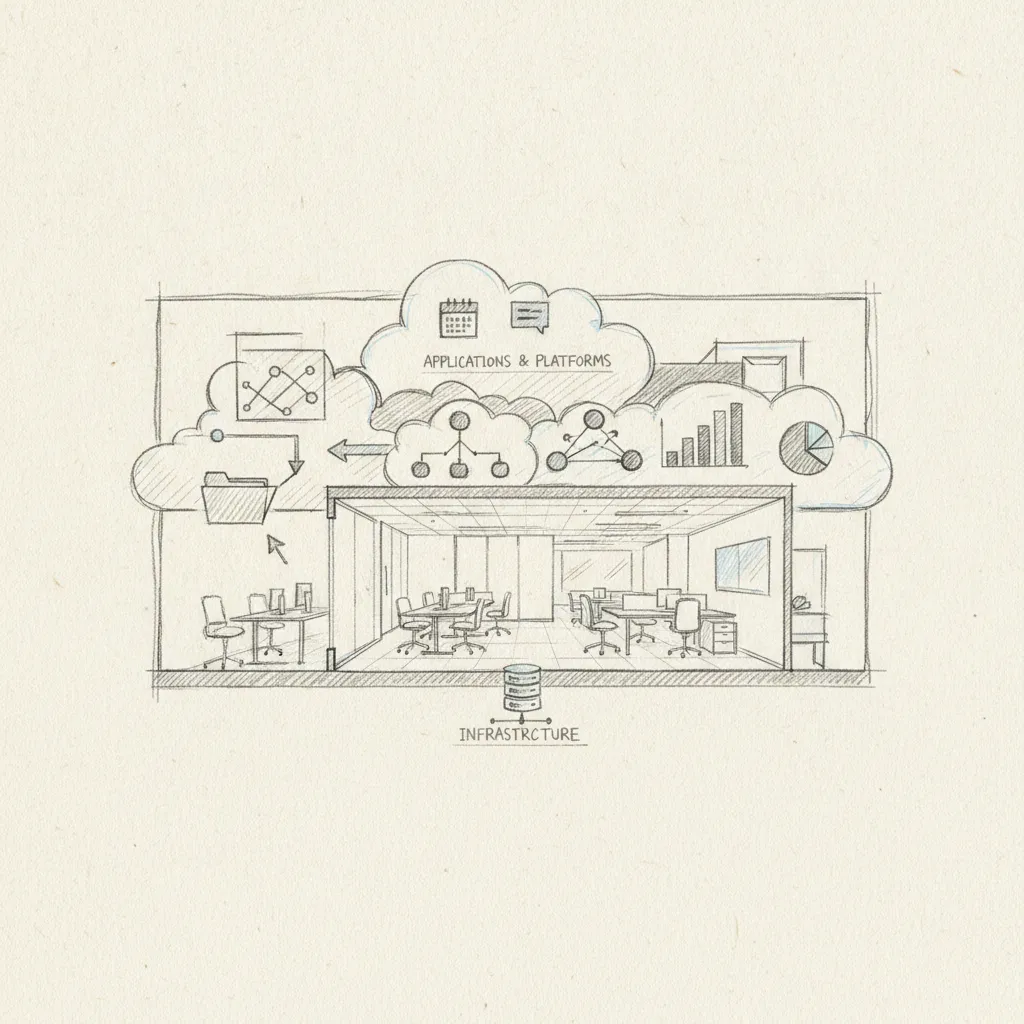
A structured 90-day deployment, covering data mapping, pilot testing, and full rollout, is the fastest path to reliable workspace data real estate visibility.
Three integration steps cause the most delays in real estate platform deployments. Address them in order before you touch anything else.
Enterprises that connect at least two data sources, desk booking and badge access, at go-live typically see utilization data coverage improve from roughly 30% to 85%+ within the first quarter. Upflex's UnifyAI engine is built to ingest both streams simultaneously, giving portfolio managers a consolidated occupancy picture without manual reconciliation.
Use this sequence to keep the deployment on track:
Change management determines whether the data you collect is trustworthy. Adoption rates fall below 50% when employees don't understand why booking data is being captured. A single internal communication, one paragraph explaining that the goal is right-sizing space, not monitoring individuals, consistently raises adoption above 80%.
Your go-live is successful when 90%+ of bookable spaces report data daily, the utilization dashboard is accessible to portfolio managers within 48 hours of any given day, and no one is pulling numbers from a spreadsheet to produce the weekly report.
Most workspace data real estate projects fail not from bad strategy but from five specific, avoidable errors that distort the numbers before any decision gets made.
"Organizations that define workspace ROI purely in terms of square footage reduction miss the larger opportunity. The data that tells you where to cut space is the same data that tells you how to design for collaboration, retention, and team performance — and those outcomes are increasingly what boards want to see." — Kate Lister, President, Global Workplace Analytics
Workspace data earns its place in real estate strategy when it connects directly to four measurable outcomes your CFO already tracks.
Start with cost per occupied seat, your target in major US markets is below $12,000 per year. Pair that with utilization rate by floor and building, aiming for 70–80% on peak days after any right-sizing. Those two numbers alone tell you whether you're paying for space your teams actually use.
The third metric is lease consolidation savings. Companies that act on 12 months of utilization data consolidate an average of 15–25% of their portfolio, a range that compounds quickly at scale. The fourth is time-to-decision for space requests: manual processes average 3–4 weeks; a live dashboard cuts that to under 48 hours.
The math is direct. A 500-person company paying $8M annually in real estate, currently running at 45% average utilization, saves $2.4M–$3.2M per year by driving utilization to 72% through data-driven consolidation. That saving funds the software platform roughly 10 times over.
Upflex's real estate portfolio optimization reporting surfaces all four metrics in one place, including rolling 90-day utilization trends and projected savings from upcoming lease decisions, the single-page format that gets CRE budget protected in annual planning cycles. For additional context on how workspace technology is reshaping real estate decisions, Yavica's workspace and real estate software insights offer a useful industry perspective on emerging platform capabilities.
Pull utilization by building every quarter and cross-reference it against your lease expiry calendar. Any location running below 60% utilization with a renewal due within 18 months is your consolidation or renegotiation window, flag it immediately and assign an owner.
Real estate decisions made on live workspace data rather than annual occupancy surveys let you respond to headcount changes in weeks, not quarters. That speed is a direct operational edge when hiring environments shift fast and locked-in leases become liabilities overnight. Companies that build this cadence turn workspace data from a one-time diagnostic into a standing input to every portfolio decision they make.
The U.S. General Services Administration's workplace innovation resources document how federal agencies have applied utilization data to reduce their real estate footprints — a model that translates directly to private-sector portfolio management.
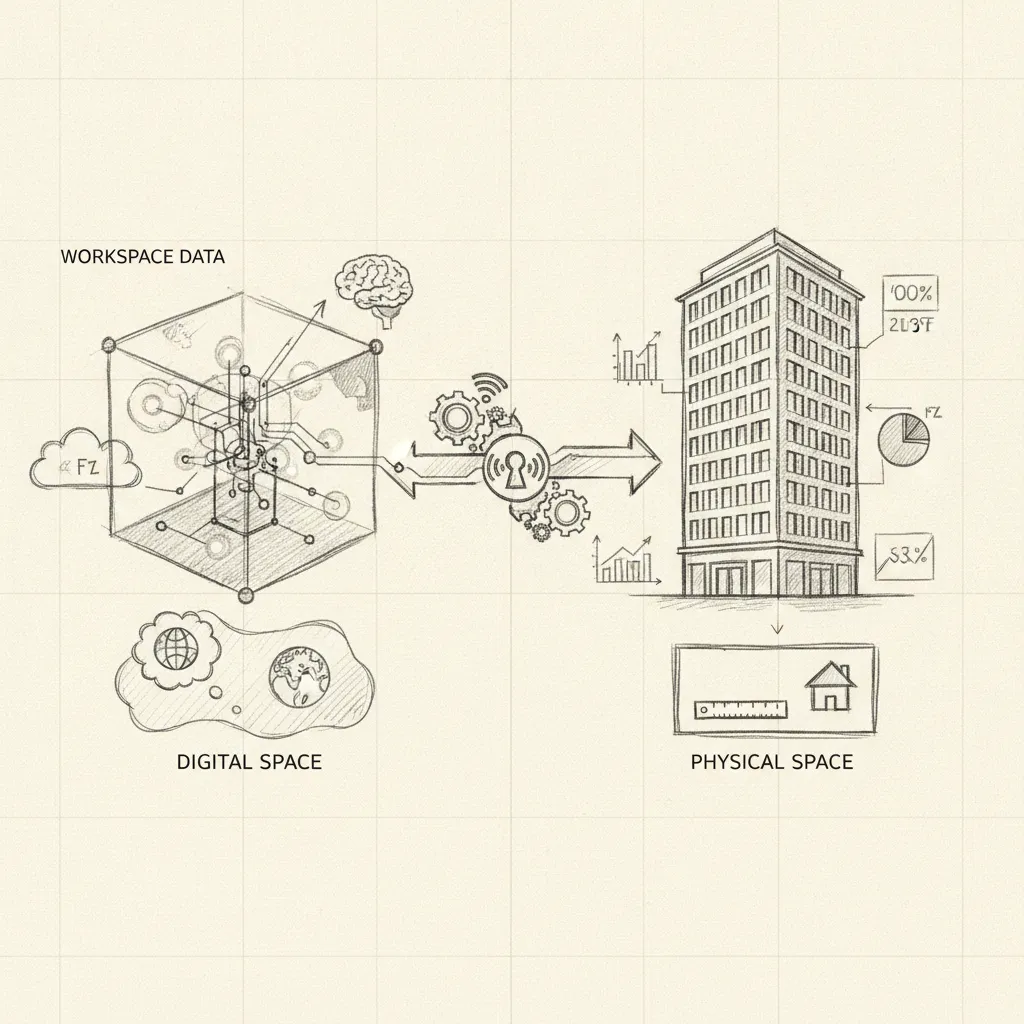
The 5 P's, Price, Place, Product, Promotion, and People, map directly to workspace data decisions. Price tells you cost-per-seat against actual utilization. Place identifies which locations your teams actually use. Product defines the type of space (open plan, private office, flex). Promotion covers how you communicate space availability. People data, who shows up, when, and with whom, is where workspace analytics add the most value, because attendance patterns drive every other variable in a hybrid portfolio.
Most enterprise workspace data platforms don't publish pricing publicly, you'll negotiate based on headcount, number of locations, and feature tier. Legacy integrated workplace management systems (IWMS) like Archibus typically carry high implementation costs alongside licensing fees. Newer SaaS platforms generally price per seat per month, with enterprise contracts often running into six figures annually for large portfolios. Request a scoped pilot before committing: the total cost of integration, change management, and training frequently exceeds the headline license fee.
Most organizations see measurable ROI within 6 to 12 months of deployment, primarily through reduced real estate spend and improved space allocation. The fastest returns come at lease renewal, when utilization data gives you the evidence to downsize or exit a location. Upflex customers have documented 40%+ reductions in real estate spend, though the timeline depends on your portfolio size, lease structure, and how quickly your team acts on the data the platform surfaces.
No single method is fully accurate on its own, combining all three produces the most reliable picture. Badge access data captures entry but misses actual desk usage. IoT sensors track physical occupancy in real time but require hardware investment and calibration. Booking data reflects intent, not always behavior. AI-powered forecasting platforms that layer all three inputs, like Upflex's UnifyAI engine, achieve the highest accuracy; Upflex reports 97% attendance forecast accuracy by processing scheduling inputs alongside utilization signals rather than relying on any one data stream.
Workspace data lets you design in-office experiences around how your teams actually collaborate, not how you assume they do [2]. Companies that use attendance and co-presence data to schedule team overlap days report stronger in-person collaboration without mandating rigid schedules. That flexibility becomes a talent differentiator, employees get meaningful face time with colleagues while retaining location autonomy. Organizations that right-size their portfolios using data also free up budget to invest in higher-quality workspace, which reinforces culture rather than undermining it.
Workspace data is the foundation of every defensible real estate decision your organization will make in a hybrid work model. Three actions matter most: consolidate your data sources, badge, sensor, and booking, into a single platform so you stop managing spreadsheets; tie utilization metrics directly to lease events so you have evidence when renewal negotiations begin; and set co-attendance targets before you cut space, not after.
If your current tools can't forecast which teams will be in the office next Tuesday with better than 90% accuracy, that's the gap to close first. Book a demo with Upflex to see how UnifyAI turns attendance forecasting into a real estate cost reduction plan with specific numbers attached.
Explore more from our content library: