Share This Article
No items found.


Desk utilization intelligence connects two things: raw occupancy data (which desks are used, when, and for how long) and the real estate decisions that data should drive. You measure it through sensors, badge data, or booking-system logs, then compare actual usage against desk supply to spot underused floors, redundant space, and peak-day crunches. The payoff is direct: hybrid organizations that track this can shrink their real estate footprint, renegotiate leases with evidence instead of guesswork, and avoid both overcrowding and wasted square footage.
You measure desk usage by combining a hardware or software signal of presence with a record of what was booked, then checking one against the other. Four data sources dominate: occupancy sensors, badge data, Wi-Fi triangulation, and booking-system check-ins. Each gives you a different accuracy-to-cost tradeoff, and most enterprises end up blending two or more to build reliable desk utilization intelligence.
Infrared and weight-based sensors mounted under desks detect a body in the seat, giving high-accuracy, real-time presence data, but they require hardware installation across every floor you want to measure. Ultrasonic sensors work similarly and handle partial-occupancy edge cases (someone standing near a desk without sitting) a bit better, at a comparable installation cost.
Badge or access-card data tells you who entered the building and when, which is cheap to capture since most enterprises already have it, but it says nothing about which desk a person actually used. Wi-Fi triangulation estimates location from network connections and scales across a portfolio without new hardware, though its floor-level accuracy is weaker and it raises more employee privacy questions than anonymized sensor counts. Booking-system check-ins are the lowest-cost option, reservations already exist, but they capture intent, not verified presence.
Desk utilization monitoring is narrow and presence-focused: it answers whether a specific desk was occupied during a specific window. Broader workplace intelligence pulls in meeting room usage, amenity traffic, and movement patterns across an entire floor or building, giving a wider picture of how space gets used beyond individual seats [4]. If you're deciding whether to consolidate a floor of assigned desks, you need desk-level data. If you're redesigning a whole office layout, you need the wider workplace intelligence layer.
Neither layer is complete without addressing the gap between what's booked and what's used. A booked desk that sits empty, a no-show, a meeting that moved, a reservation made "just in case", inflates perceived demand until a sensor confirms nobody sat down. Some industry data puts realized office utilization far below booked or badge-in rates even during high-traffic periods [2], which is exactly the kind of gap that erodes trust in real estate decisions built on booking data alone.
Desk utilization intelligence gets more reliable when passive sensor data and self-reported booking data are checked against each other rather than trusted individually. Upflex's UnifyAI engine works this way: it forecasts attendance with 97% accuracy by combining scheduling inputs with actual utilization data, so the desk booking workflow reflects who's coming in rather than who merely reserved a spot.
Five metrics form the backbone of desk utilization intelligence: peak occupancy rate, average daily utilization, desk-to-employee ratio, day-of-week variance, and dwell time, and none of them means much read in isolation.
Peak occupancy rate measures the highest percentage of desks in use during any single observation window, usually the busiest hour of your busiest day. It tells you how much space you need for the worst-case crunch, not the average week.
Average daily utilization looks at desk usage across all measured days, active or slow. This is the number most CFOs care about because it reflects what you're actually paying for versus what's sitting empty.
Desk-to-employee ratio compares total desks available to total employees assigned to that space. A ratio that ignores hybrid attendance patterns almost always overstates how much square footage a team actually needs.
Day-of-week variance tracks how sharply attendance swings between, say, Tuesday and Friday. In most hybrid offices this swing is the single biggest driver of wasted capacity, buildings sized for Tuesday sit half-empty by Friday.
Dwell time measures how long a desk stays occupied once someone sits down, which separates people actually working from desks marked "in use" by an abandoned laptop or bag.
A single week of utilization data, or worse, a single day, will mislead almost every real estate decision built on top of it. Hybrid attendance swings by day of week, so a snapshot taken on a quiet Monday looks nothing like the same floor on a packed Wednesday.
Set a baseline before you touch anything. Measure current-state utilization for a minimum of several weeks, ideally spanning a full work cycle that includes typical highs and lows, before consolidating floors, cutting desks, or renegotiating a lease.
Segment that baseline by team, floor, and day of week rather than rolling everything into one company-wide average. A sales floor running at high occupancy on Wednesdays can mask an engineering floor that's nearly empty all week, averaging the two hides the decision that actually saves money.
Strip out anomalies before drawing conclusions. Holiday weeks, company offsites, and system outages distort the data and make a normal week look like an emergency or a non-issue when it's neither.
Benchmark against your own hybrid mandate, not a generic industry figure. A company with a three-day-a-week policy should expect occupancy patterns entirely different from one with a five-day return-to-office rule, so the "right" utilization number depends on the policy you've set, not a number pulled from someone else's portfolio. Upflex's UnifyAI engine builds this baseline automatically, forecasting attendance with 97% accuracy so real estate leaders compare current utilization against a policy-specific benchmark rather than a generic average, turning raw desk utilization intelligence into a number the finance team can actually use.
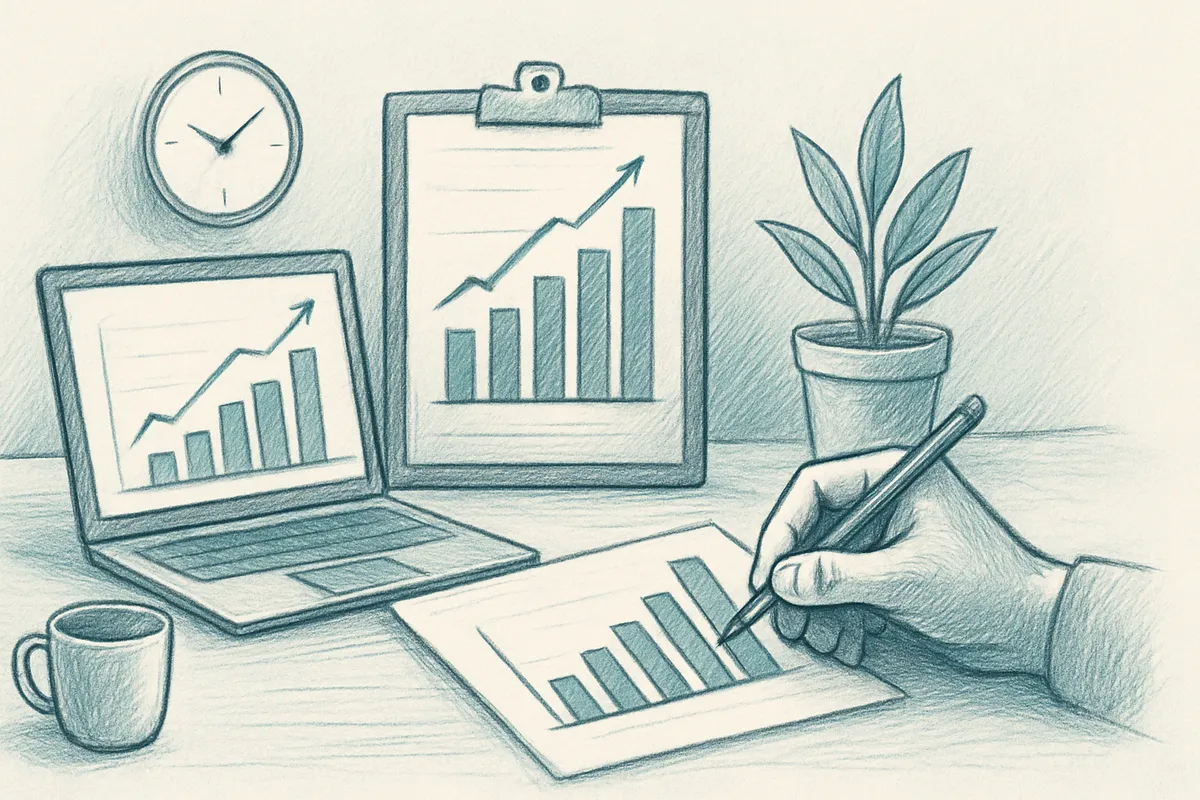
Utilization data turns a lease renewal or footprint review from a guessing exercise into a math problem: consistent underuse points straight at which floors, buildings, or sites to consolidate, sublease, or let expire. That mechanism only works if the underlying numbers are trustworthy, which is exactly what desk utilization intelligence is built to deliver, a clear, ongoing read on which desks and floors actually get used, not just how many badges swiped in.
Once a pattern holds for a full quarter or two, a floor running at a fraction of capacity every week, a satellite office rarely above a third full, that space becomes a candidate for action at the next natural decision point: lease renewal, a sublease opportunity, or a planned consolidation. Real estate leaders don't need daily fluctuation; they need the trend line.
The ROI comes from three concrete levers: less square footage under lease, build-outs you can defer or cancel, and stronger footing when renegotiating terms with a landlord who knows your utilization numbers as well as you do.
A rough cost/benefit case starts with a simple unit: cost per square foot avoided for every consistently underused desk. If a floor holds 200 desks but peak attendance never exceeds 120, the other 80 are carrying full occupancy cost, rent, utilities, cleaning, security, for close to zero return. Multiply that gap by square-foot cost and by lease term, and the case for giving back a floor or exiting a building writes itself, without needing to promise a specific savings percentage in advance.
Right-sizing means matching desk count to actual peak demand, not headcount on the payroll system. A team of 300 that never has more than 180 people in the building on its busiest day doesn't need 300 desks, it needs enough desks to comfortably cover that peak, plus a reasonable buffer, and nothing more.
Get that number wrong in either direction and it costs you. Too few desks and Tuesdays turn into a scramble that undermines any return-to-office push; too many and the company pays full occupancy cost for chairs nobody sits in the rest of the week. Utilization data resolves that tension by showing the real peak, not the theoretical one.
The same logic scales beyond a single office. Run utilization comparisons across every site in the portfolio and patterns emerge, one region chronically overbuilt, another running hot, that inform scenario planning for renewals and consolidation across the whole footprint, not just desk counts on one floor. Upflex supports this directly: its real estate portfolio optimization surfaces utilization data across owned offices, feeding the consolidation and footprint-reduction decisions that have driven documented reductions of 40%+ in real estate spend for companies acting on the numbers rather than the org chart.
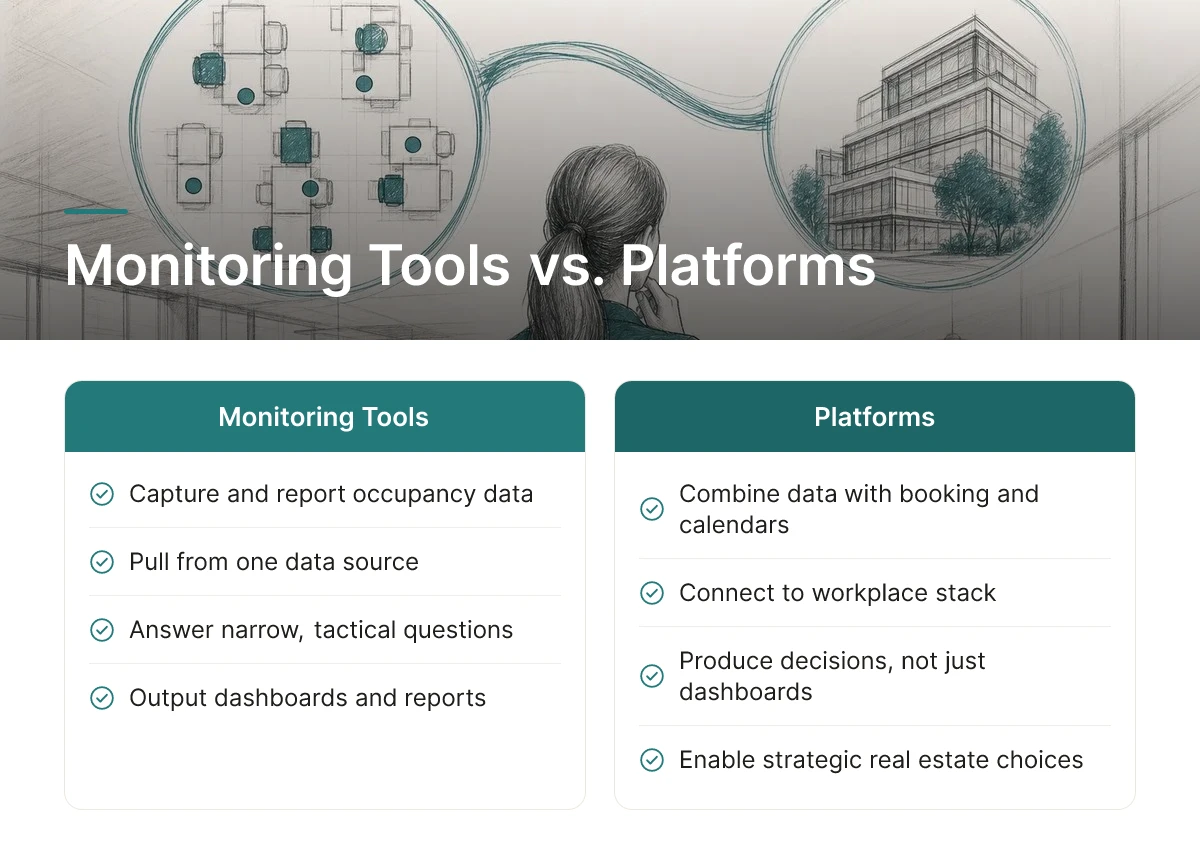
Monitoring tools capture and report occupancy data; platforms combine that data with booking, calendars, and space plans to produce decisions rather than just dashboards. Confusing the two leads real estate teams to buy sensors when what they actually need is desk utilization intelligence that connects to the rest of the workplace stack.
A monitoring tool answers a narrow question: how many desks were occupied on a given floor at 2 p.m. on Tuesday. It typically pulls from one data source, badge swipes, Wi-Fi logs, or sensors, and outputs a report [3]. That's useful, but it stops short of telling a real estate leader what to do about a lease renewal or a headcount forecast.
A platform goes further. It layers utilization data on top of booking systems, HR calendars, and floor plans, then surfaces recommendations, which floors to consolidate, which teams to co-locate, which leases to exit. Upflex, for example, pairs attendance forecasting with desk booking and portfolio-level reporting, so real estate leaders see not just what happened last week but what's likely to happen next quarter and what it should cost. This is desk utilization intelligence applied as an operating system for the office, not a one-off report.
Utilization data only becomes decision-ready when it connects to the calendar, badge, and space-management systems your organization already runs, otherwise it sits in a silo nobody checks.
Most enterprises already have a patchwork: Microsoft 365 or Google Workspace calendars, an access-control system for badges, maybe a legacy IWMS holding floor plans. A monitoring tool that can't read or write to those systems forces someone to manually reconcile spreadsheets every week, exactly the fragmented workflow that erodes trust in the numbers [4]. Integration depth, not sensor accuracy alone, determines whether utilization data gets used or ignored.
Evaluate vendors on four criteria: how the data is measured, how deeply it integrates, how flexible the reporting is, and how access is controlled.
Budget-friendly tools tend to cover single-source monitoring and basic reports. Mid-range platforms add calendar and booking integration. Enterprise-tier platforms add forecasting, multi-site aggregation, and portfolio-level cost modeling, which is where desk utilization intelligence starts to function as a genuine decision-support system rather than a dashboard.
Organizational scale should drive the choice. A single-site company may only need a monitoring tool to track one building. A multi-site portfolio spanning several countries needs platform-level aggregation to compare utilization across locations and make consolidation decisions with confidence. For a closer look at how vendors frame this category, see this overview of desk utilization intelligence as a standalone capability.
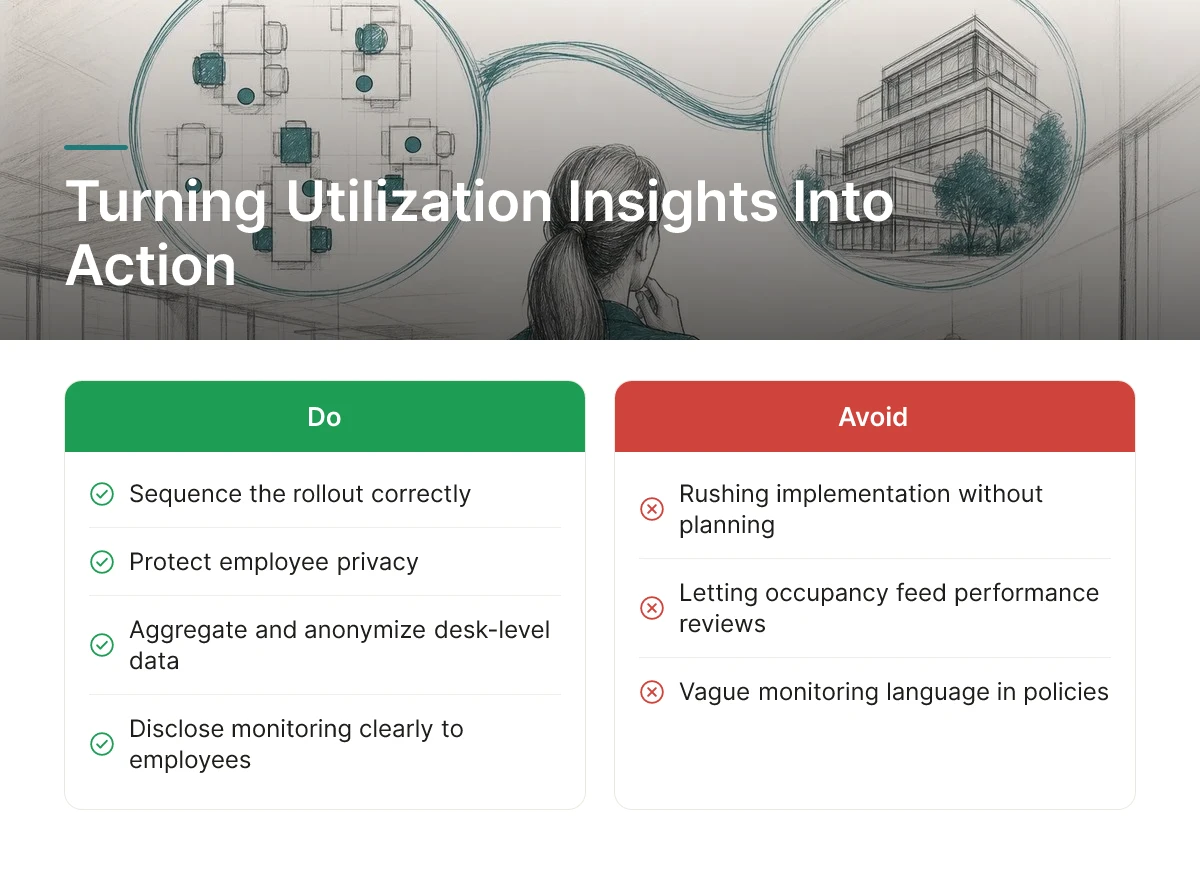
Desk utilization intelligence only pays off when you sequence the rollout correctly, protect employee privacy, and manage the human reaction before you touch a single floor plan.
Aggregate and anonymize desk-level data before it reaches anyone outside the workplace team, and never let occupancy records feed individual performance reviews. Under GDPR and CCPA, employees generally need clear disclosure of what's being monitored, why, and how long the data is retained, vague "we track office usage" language in an employee handbook isn't enough.
Report utilization by floor, zone, or team, not by badge ID or named desk. If line managers ask for individual attendance breakdowns, redirect that request to existing HR attendance policy rather than repurposing sensor or badge data for it. Mixing the two creates legal exposure and destroys trust in the monitoring program before it produces a single useful insight.
Pilot on one floor first, validate the readings against manual headcounts, then expand, acting on findings only after you've completed a full measurement cycle across a normal week, including a slow Monday and a busy Wednesday. A single week of data from one floor tells you nothing about whether the pattern holds company-wide.
Before rollout, tell employees why monitoring is happening, cost control, space planning, better desk availability, not just that it's happening. Involve team leads in reading the results; they'll catch context sensors miss, like a team that clusters near a window regardless of formal seating charts. Pair any physical change with employee input sessions before you announce it, not after, since space changes announced without warning generate more resistance than the change itself usually warrants.
Once the data holds up, action follows a logical order: consolidate underused floors first, shift to activity-based or unassigned seating where the numbers support it, and phase reductions to line up with lease break dates rather than acting all at once. Upflex's UnifyAI engine supports this sequence directly, it forecasts attendance with 97% accuracy so real estate teams can validate patterns before committing to a floor consolidation, and its desk booking and on-demand workspace network give employees flexible access during the transition instead of a hard cutover. That combination is what turns desk utilization intelligence into a real estate decision a CFO will actually sign off on.
Run at least a full business quarter, spanning 10-12 weeks, before acting on desk data. Shorter windows miss seasonal swings, holiday weeks, and month-end travel patterns. A quarter also captures at least one full budget cycle, giving finance leaders a defensible baseline instead of a snapshot that could be an outlier week.
Consent requirements depend on your jurisdiction and the tracking method, so check local labor and privacy law before deploying sensors or badge-based tracking. Aggregated, anonymized occupancy data typically carries lower compliance burden than individually identifiable tracking. Most enterprises address this through workplace policy disclosure and by choosing tools that report at the desk or floor level, not the individual level.
Small offices benefit too, though the payoff scales with square footage and lease value. A 50-desk office with 30% utilization still wastes real money on unused space. The difference is mainly urgency: a single-location company can often fix layout issues through observation, while multi-site portfolios need software to compare locations consistently.
Most hybrid offices target 60-80% utilization on peak in-office days, not 100%, since full capacity every day signals under-provisioning, not efficiency. Industry data shows many offices actually run far below this: one occupancy index puts average utilization at just 9-11%, even with peak days reaching 52-60% of capacity [2]. The right target depends on your team's collaboration needs and desk-sharing ratio.
A headcount report counts people scheduled or badged into a building; it says nothing about which desks they actually used or for how long. Desk utilization intelligence layers presence data, dwell time, and booking behavior on top of that headcount so real estate teams can see actual seat-level demand, not just how many people were somewhere in the building on a given day.
Desk utilization intelligence only pays off when it changes a decision: a lease renewal, a floor consolidation, a desk-to-employee ratio. Badge data or sensors alone won't get you there, you need forecasting that tells you who's coming in before they arrive, not just who showed up last month. That's the gap between passive monitoring and a system like Upflex, which pairs 97% accurate attendance forecasting with desk booking and on-demand workspace access, so real estate decisions rest on where teams are actually headed, not where they've been. Start by pulling your last quarter's occupancy data and comparing it against your current desk count, the gap will tell you exactly where to act first.
Explore more from our content library: