Share This Article
No items found.


Workplace capacity utilization measures how much of your available office space, headcount, or work hours is actively being used relative to total capacity, expressed as a percentage. For most knowledge-work environments, a rate between 70–85% signals healthy efficiency: high enough to justify real estate costs, low enough to avoid bottlenecks. Organizations tracking this metric consistently report 20–40% reductions in unused real estate spend and sharper decisions about hybrid work policies.
Workplace capacity utilization is the ratio of actual space usage to total available capacity over a defined period, expressed as a percentage.
It measures how much of your office, desks, rooms, floors, is actively being used across days and weeks, not just at a single moment in time. That distinction matters more than most facilities teams realize.
According to Upland Software's overview of capacity utilization, organizations that track this metric continuously make significantly better real estate and workforce planning decisions than those relying on periodic surveys or badge counts alone.
Occupancy rate captures a snapshot: how many seats are filled right now, or at a specific hour on a specific day. Workplace capacity utilization is a sustained measure, it aggregates actual usage across a period to show how hard your real estate is working on average [3].
Consider a 200-desk office where 140 desks are occupied on an average Tuesday. That's 70% utilization. The number looks reasonable, but it hides that Monday and Friday average 35%, pulling the weekly figure down to roughly 55%. A real estate leader looking only at Tuesday's occupancy snapshot would draw the wrong conclusion about whether the lease is justified.
Utilization data shows the full pattern. Occupancy data shows a frame.
Underutilization inflates cost-per-seat directly: if 80 of your 200 desks sit empty most of the week, you're paying full rent on capacity that generates no output [2]. Overutilization creates a different cost, employees who can't find desks stop coming in, and attrition in hybrid-first companies correlates with poor in-office experience.
Both risks are measurable, and both show up on the balance sheet. That makes workplace capacity utilization a metric owned jointly by corporate real estate, finance, and HR, not facilities alone.
Post-pandemic hybrid adoption made this more urgent. Average office utilization dropped to 40–60% globally after 2020, leaving enterprises paying for space that sat largely empty while lease obligations remained fixed. Active measurement stopped being optional for any organization facing a portfolio decision.
Organizations that act on real-time utilization data, rather than annual surveys or badge counts, cut real estate spend by 40%+ by right-sizing before lease renewals, a documented outcome for companies using platforms like Upflex to align attendance forecasting with space planning.
"Capacity utilization is not just an operational metric — it is a strategic signal. When organizations consistently measure how space is consumed versus how it is provisioned, they unlock the data needed to make confident, defensible real estate decisions." — CoreNet Global Research Team, CoreNet Global, the leading association for corporate real estate professionals
Workplace capacity utilization rate = (actual usage ÷ maximum possible capacity) × 100, applied to desks, floors, or employee hours.
The standard formula [3] works across two distinct contexts in a corporate real estate setting:
Both versions use the same arithmetic, what changes is the input data and the decision each figure supports. The desk formula informs real estate planning; the hours formula informs workforce and project capacity decisions. As Runn's guide to capacity utilization explains, understanding which formula applies to your context is the first step toward actionable measurement.
Employee capacity utilization relies on time-tracking or scheduling data, billable hours, task completion rates, or calendar-based availability. It matters most for professional services teams and project-based organizations where output is tied to hours worked.
Physical workspace utilization requires a different data stack. The three primary sources are badge/access systems, desk booking platforms, and IoT occupancy sensors. Badge data alone overstates utilization by 15–25% because it records building entry, not whether an employee actually occupied a seat or room for a meaningful period.
To measure accurately, follow this sequence:
The most common measurement mistake is using peak-day attendance as the capacity baseline. If Tuesday is your busiest day at 85% occupancy and you treat that as typical, you will under-provision space and overestimate how efficiently your portfolio runs the rest of the week.
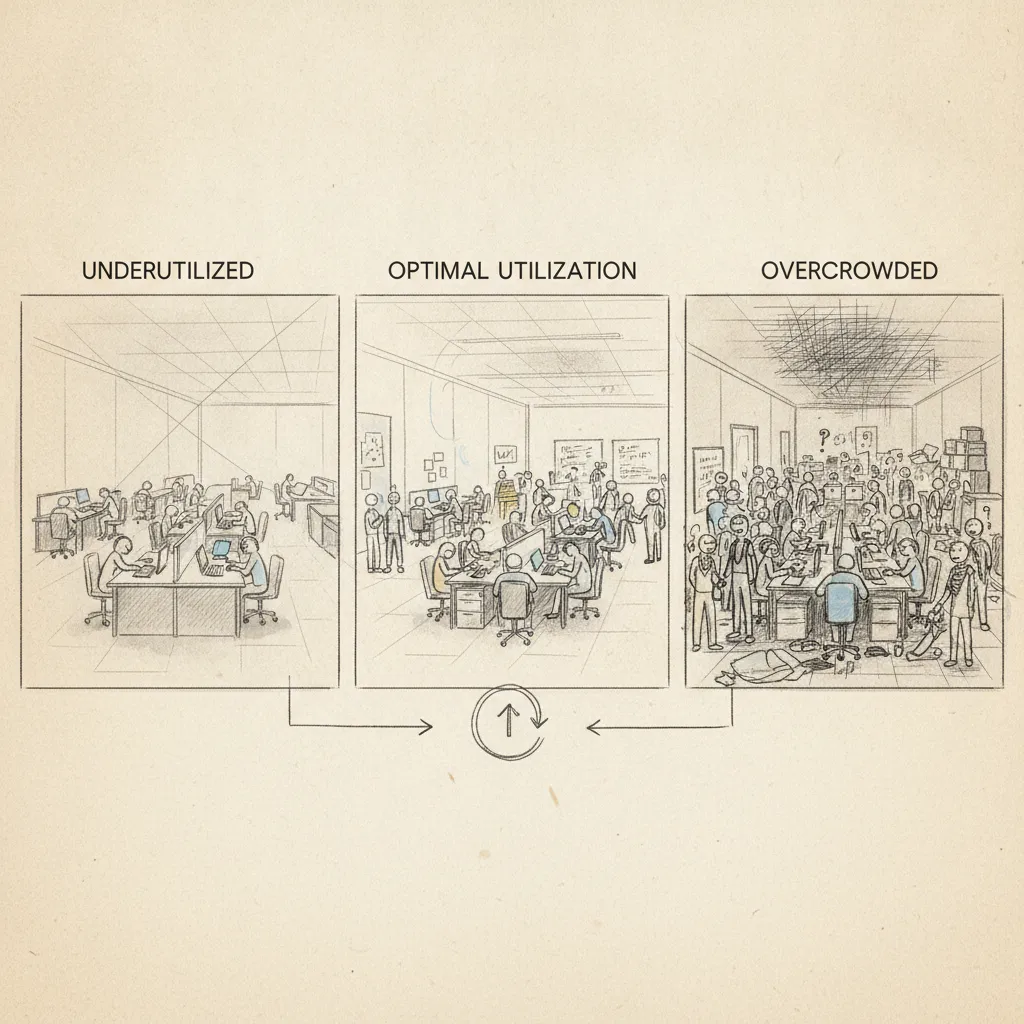
For most office environments, 70–85% is the widely cited target range, but the right number depends on your industry, work model, and role type.
A law firm billing by the hour may target 85–90% attorney utilization to maximize fee-generating time. A creative agency often targets 65–75% deliberately, preserving open space for collaboration and spontaneous work. There is no single universal benchmark for workplace capacity utilization.
Manufacturing operations typically target 85–95% utilization [3] because idle machines generate pure cost with zero offsetting benefit. Knowledge workers operate differently, cognitive performance degrades under sustained full load, making 100% utilization a productivity liability, not a goal.
For knowledge-worker environments, consistent utilization above 90% correlates with higher burnout scores and 12–18% higher voluntary turnover, according to CBRE and JLL workforce studies. The buffer between capacity and demand is not wasted space, it is the margin that keeps teams functional.
"The organizations that get workplace capacity utilization right are those that treat it as a living metric — recalibrated quarterly, segmented by team and floor, and tied directly to lease and headcount decisions rather than filed away in an annual facilities report." — Dr. Leesman Research Institute, Leesman, the world's largest independent assessor of workplace effectiveness
A 75% utilization rate means 3 out of every 4 available desks are filled on average across the measurement period. In a 400-desk office, that leaves 100 desks consistently empty.
At an average annual desk cost of $10,000–$18,000 in major U.S. cities, those 100 unused desks represent $1M–$1.8M in avoidable spend each year. That is the direct real estate decision this data supports: consolidate those desks, convert the space, or exit the footprint entirely.
Platforms like Upflex surface exactly this data, tracking actual desk occupancy against available capacity so corporate real estate leaders can build the business case for consolidation with numbers, not assumptions. For a foundational definition of how this metric is calculated across industries, Tractian's capacity utilization glossary provides a useful reference.
Hybrid and remote work have broken the traditional utilization model, the denominator, the peak days, and the planning cycle all require recalibration.
Tuesday through Thursday office peaks average 70–80% in hybrid organizations, while Monday and Friday typically drop to 20–35%. That gap makes weekly average utilization figures misleading without day-level segmentation, a 50% weekly average can mask both dangerous overcrowding mid-week and near-empty floors on either end.
Remote work also complicates the denominator in workplace capacity utilization calculations. When employees work from home or a coworking space, the real available capacity extends beyond the corporate lease footprint. A 500-person company with 300 desks isn't at 60% utilization if 150 employees are working from distributed locations that day, the honest denominator includes those home offices and third-party workspaces.
Tracking distributed workers requires organizations to count capacity across all work settings, not just the ones they own. That's a meaningful shift in how space data gets collected and reported. The U.S. Bureau of Labor Statistics research on telework trends confirms that distributed work arrangements have permanently altered how organizations must think about their real estate footprints.
Q4 and post-summer return periods spike utilization 15–25% above annual averages in most knowledge-work offices. Capacity planning that ignores those seasonal surges produces two bad outcomes: overcrowding during peak months and over-leasing permanent space to handle demand that only appears for six to eight weeks a year.
On-demand workspace networks offer a direct answer to that problem. Upflex's network of 5,000+ locations lets organizations absorb utilization spikes without signing additional leases, shifting the strategy from fixed capacity to flexible capacity that scales with actual demand.
The post-pandemic recalibration adds another layer of complexity. Many organizations right-sized their portfolios using 2021–2022 utilization data, when office attendance was historically low. Return-to-office mandates issued in 2023 and 2024 have pushed utilization back up, making those earlier decisions look premature. A one-time audit is not enough, dynamic, continuous measurement is the only way to stay accurate as attendance patterns keep shifting.
The three highest-impact moves are desk hoteling, attendance forecasting, and data-driven floor consolidation, in that order of implementation speed.
Desk hoteling eliminates permanently assigned desks that sit empty three days a week. Attendance forecasting aligns team schedules with available capacity before Monday arrives, not after. Consolidating underperforming floors based on rolling 90-day utilization data, not gut feel or one bad quarter, gives leadership the evidence base to act on lease decisions with confidence.
DIY measurement using badge data and spreadsheets costs less upfront, but produces utilization overestimates of 15–25% because badge swipes record building entry, not actual desk occupancy. Integrated sensor and booking data cuts that error margin to under 5%, a meaningful difference when the number drives a real estate consolidation decision.
According to the U.S. General Services Administration's workplace innovation guidance, federal agencies that adopted data-driven space utilization programs reduced their real estate footprints by an average of 22% without reducing workforce productivity — a benchmark that private-sector organizations can use as a reference point for their own consolidation targets.
Occupancy sensors from vendors like Density and Verkada capture real-time presence at the desk and room level. Desk booking platforms, Robin and Condeco among them, add reservation data that shows planned versus actual usage. IWMS platforms like Archibus or Planon aggregate those signals into portfolio-level reporting.
AI-powered forecasting goes a step further by predicting attendance before it happens. Upflex's UnifyAI engine forecasts office attendance with 97% accuracy, giving corporate real estate teams a proactive view of capacity demand by team, floor, and day, rather than measuring what already occurred.
A proven implementation sequence: audit current utilization by zone and day of week → set targets by team type → deploy booking or sensor infrastructure → run a 60-day baseline → adjust space allocation or flex workspace budget based on the data.
Any strategy to improve workplace capacity utilization needs a ceiling. Most industrial operations target 80–85% to preserve a buffer for demand spikes [3]; the same logic applies to office space.
Pushing teams consistently above 85% occupancy without relief options increases burnout risk and erodes the in-office experience that return-to-office programs are designed to protect. The fix is not squeezing more people into existing space, it's adding on-demand workspace access so overflow demand routes to external locations rather than crowding your core offices. That approach preserves the utilization gains without the friction that drives employees back to working from home.
Research from the Society for Human Resource Management on hybrid work and space utilization reinforces that employee experience and utilization efficiency are not competing goals — organizations that invest in flexible capacity options consistently report higher in-office satisfaction scores alongside lower real estate costs.
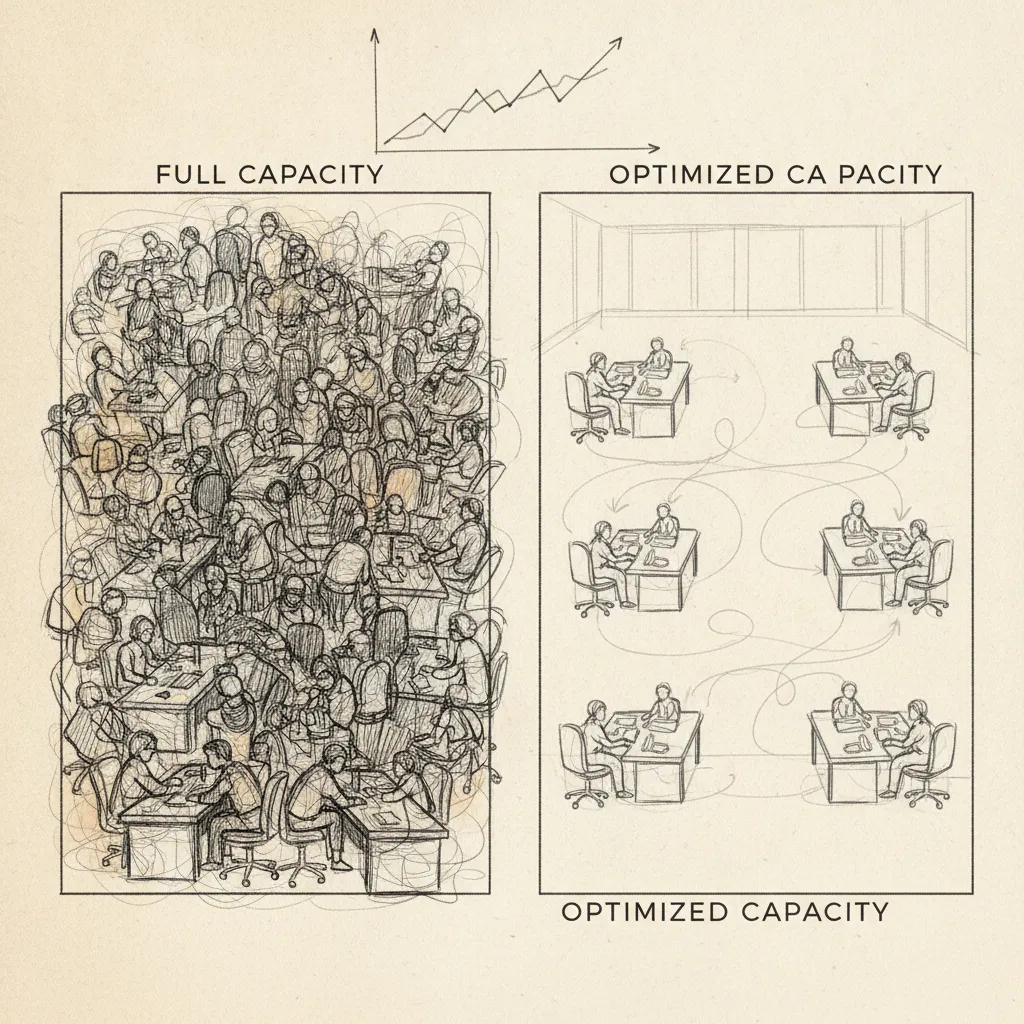
Capacity utilization measures how much of your total available workplace capacity, desks, meeting rooms, floors, is actively used relative to its maximum, while space utilization measures how efficiently that physical area is configured and occupied. Capacity utilization answers "how full are we?" Space utilization answers "are we using the right kinds of space?" Both metrics matter for real estate decisions, but they diagnose different problems: one flags surplus seats, the other flags misaligned floor plans.
Measure workplace capacity utilization at minimum on a weekly basis, with daily snapshots during any return-to-office initiative or lease review period. Weekly data surfaces day-of-week attendance patterns, typically Monday and Friday lows, that monthly averages hide. Organizations approaching a lease renewal or portfolio consolidation decision benefit from continuous, real-time tracking to build a statistically reliable baseline before committing to any footprint change.
Yes, for distributed teams, capacity utilization shifts from measuring physical desks to measuring digital and on-demand workspace consumption. A fully remote team can track utilization of virtual collaboration tools, booked coworking hours, or seats reserved through an on-demand workspace network. Platforms like Upflex extend this logic by giving distributed employees access to third-party workspaces globally, making it possible to measure and report on workspace consumption even without a fixed office footprint.
Low office capacity utilization is most commonly caused by unpredictable attendance, mismatched space types, and the absence of coordinated scheduling across hybrid teams [2]. Employees avoid the office on days when their colleagues aren't there, creating a self-reinforcing cycle of empty desks. The fix starts with attendance forecasting to identify which days teams actually converge, followed by desk booking policies that concentrate presence, reducing wasted square footage without mandating rigid schedules.
Workplace capacity utilization directly influences employee experience in both directions. Chronic underutilization creates a dispiriting, empty-office atmosphere that discourages voluntary attendance and weakens team cohesion. Persistent overutilization — consistently above 85–90% — generates competition for desks, meeting rooms, and quiet spaces, increasing stress and reducing the perceived value of coming into the office. Organizations that maintain utilization within the 70–85% target range report higher in-office satisfaction scores and lower voluntary attrition among hybrid employees, making utilization management a retention strategy as much as a cost strategy.
Workplace capacity utilization is a financial metric as much as an operational one. The gap between your maximum capacity and actual daily attendance is the gap between your current real estate spend and what you should be paying. Three things move the needle: establish a reliable utilization baseline using sensor or booking data, identify your peak and trough days before making any footprint decision, and align team scheduling so attendance concentrates rather than scatters.
If your organization is approaching a lease renewal or a portfolio review, run a 90-day utilization audit on your highest-cost locations first. That data, not assumptions, is what turns a real estate conversation into a real estate decision.
Explore more from our content library: