Share This Article
No items found.

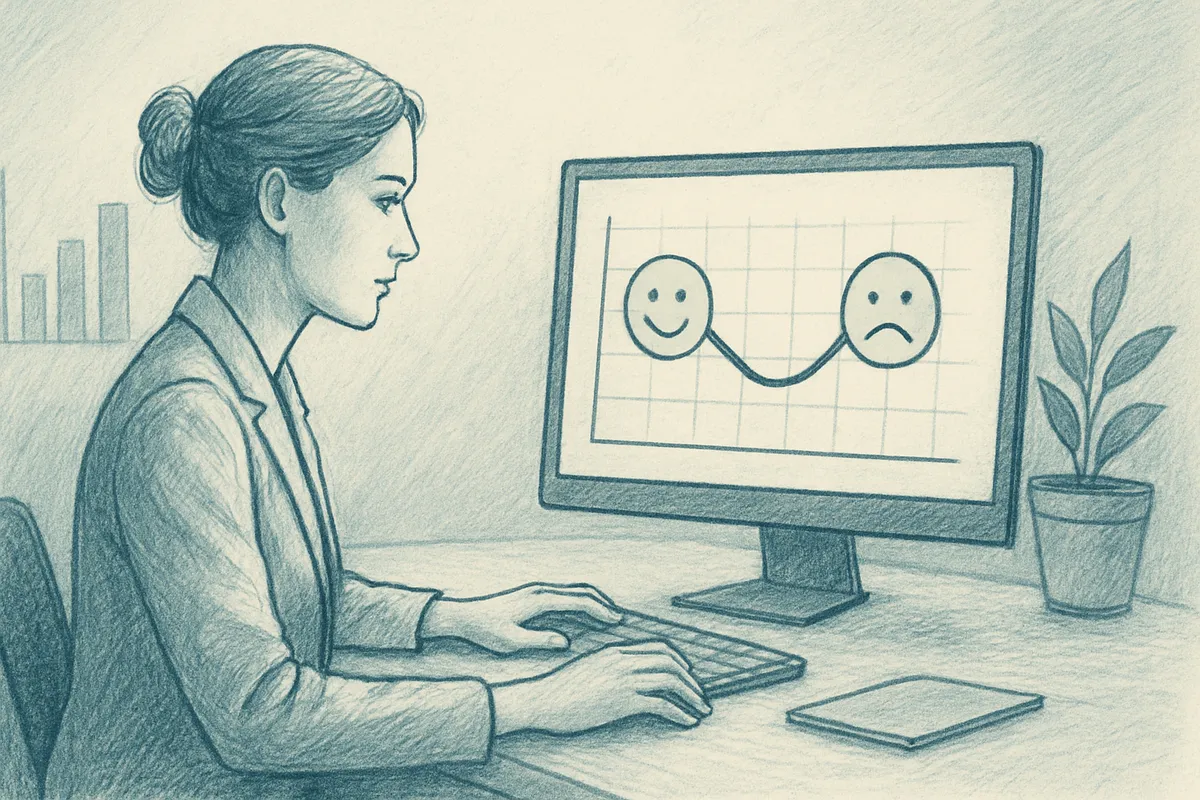
Workplace sentiment analytics is the practice of continuously capturing, measuring, and interpreting how employees feel about their work, environment, and organization, using methods that range from pulse surveys to natural language processing of open-ended feedback. Unlike annual engagement surveys, workplace sentiment analytics surfaces mood shifts in near real-time, giving leaders actionable signals before disengagement or attrition takes hold. Organizations that act on sentiment data consistently report stronger retention, faster culture corrections, and more informed workforce decisions.
Workplace sentiment analytics converts employee emotional signals into structured, trackable data that leaders can act on before problems compound.
It draws from two distinct data types: structured inputs like rating scales, eNPS scores, and Likert-based pulse surveys, and unstructured inputs like open-text survey responses, meeting transcripts, and communication patterns. Annual engagement surveys produce a single composite score, useful as a benchmark, but blind to the weeks and months of drift that precede it.
The gap between annual engagement surveys and sentiment analytics comes down to three things: cadence, data richness, and directional visibility.
Annual surveys capture a point-in-time score. Sentiment analytics runs continuously, which means it can detect a downward trend in a specific team three weeks after a leadership change, not six months later at the next survey cycle. It also captures qualitative signals that a five-point Likert scale cannot: the language employees use, the topics that surface repeatedly in open text, and the emotional tone behind them [3].
That directional capability matters most when culture problems are forming. A lag between a problem emerging and leadership detecting it gives disengagement time to spread and attrition to accelerate. Shortening that detection window is the core mechanism behind the business case for continuous sentiment measurement.
Sentiment analytics programs typically monitor a defined set of signals rather than a single score [2].
This granularity matters especially in hybrid and distributed environments. When employees are not physically present, managers lose the informal cues, body language, hallway conversations, visible energy levels, that once served as early warning signals. Workplace sentiment analytics becomes the primary substitute for that direct observation, giving distributed team leaders data-driven visibility into morale they can no longer read in person [3].
Reliable workplace sentiment analytics depends on combining multiple data sources, no single collection method captures the full picture on its own.
Pulse surveys, short, frequent check-ins of 3–5 questions, catch fast-moving mood shifts tied to specific events like a policy change or leadership announcement. Always-on feedback channels, such as a standing suggestion form or a Slack-integrated tool, capture sentiment from employees who won't wait for the next scheduled survey. Each method reaches a different slice of the workforce at a different moment.
1:1 conversation analysis, when transcripts are processed through natural language processing (NLP), surfaces themes that employees rarely write in a survey, frustration with a specific manager, anxiety about job security, or confusion about hybrid expectations [3]. Collaboration tool signals (message sentiment in Teams or Slack, response latency, after-hours activity patterns) add a passive layer that requires no employee action at all. Exit interview text rounds out the picture by capturing sentiment at the moment employees have the least reason to filter their honesty.
Distributed teams present a structural challenge: the passive in-person signals that office environments generate, body language, hallway conversation, visible disengagement, simply don't exist. Survey response rates also tend to run lower in remote settings, partly because employees lack the ambient social pressure that makes ignoring a survey feel conspicuous.
Asynchronous communication channels fill part of that gap. Chat logs, email tone, and project tool activity can all serve as sentiment data sources when processed with appropriate NLP tooling. The key is obtaining explicit consent and maintaining clear anonymization protocols, without both, employees adjust their digital communication rather than expressing honestly.
Quantitative methods, scaled Likert questions, eNPS scores, and attendance-linked engagement metrics, give you trend lines you can benchmark quarter over quarter [2]. They tell you that sentiment dropped in Q3; they don't tell you why.
Qualitative methods, specifically open-text responses and interview transcripts processed by NLP, supply the reasoning behind the score [3]. A team's eNPS may be flat while open-text responses reveal a specific concern about return-to-office policy, a distinction that changes what action you take.
Survey design quality determines whether either type of data is trustworthy. Leading questions, over-surveying (which triggers fatigue and rote responses), and the absence of genuine anonymity guarantees all degrade data before it reaches analysis. High-cadence pulse surveys catch inflection points but accelerate fatigue; lower-cadence deep surveys capture nuance but miss fast-moving shifts. The right frequency tracks how quickly your organization is changing, not how often your team wants to send a survey.
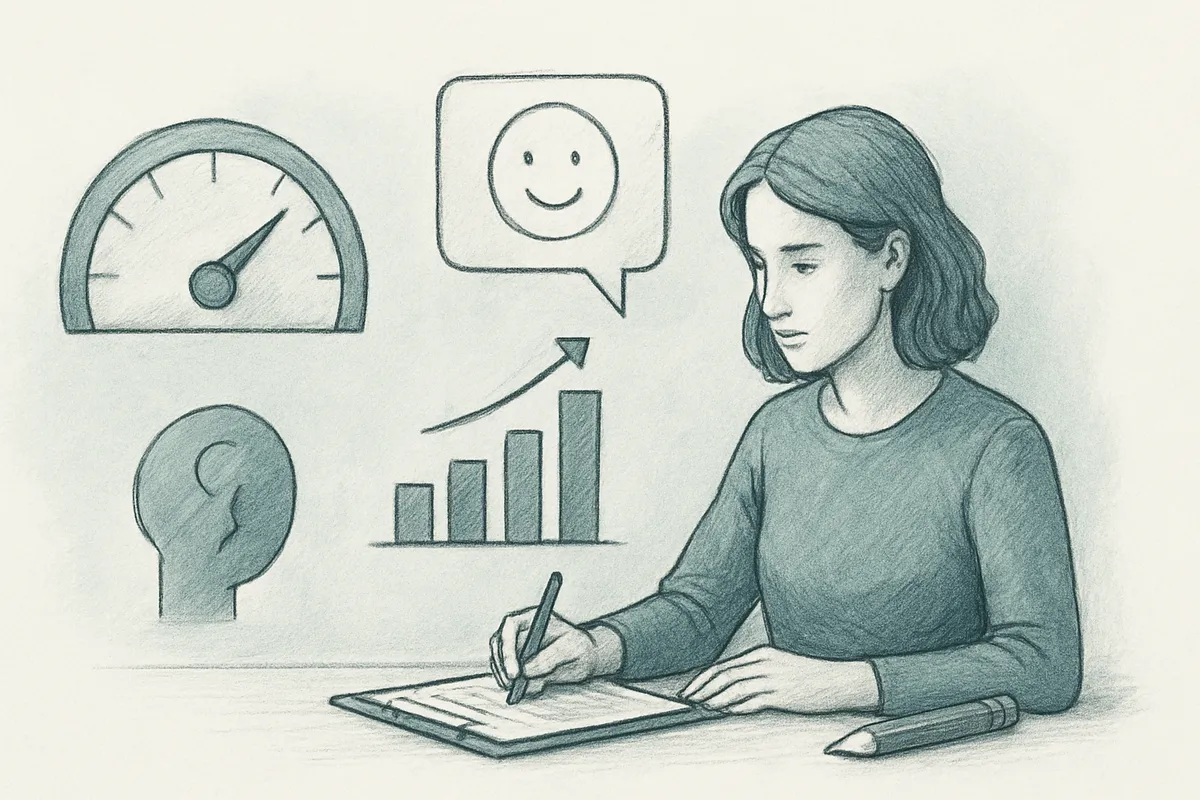
Effective workplace sentiment analytics tools separate themselves from basic survey software through NLP depth, privacy architecture, and integration fit with existing workflows.
General-purpose sentiment models, trained on product reviews or social media, misread workplace language. A model that flags "my manager is killing it" as negative is useless. Platforms trained on workplace-specific corpora classify text more accurately, correctly identifying sentiment polarity (positive, negative, neutral) and grouping responses into recurring themes like workload, flexibility, or leadership through topic modeling.
Beyond classification, look for emotion detection that distinguishes frustration from disengagement, two states that call for different responses. Real-time dashboards let HR and workplace leaders act on signals before they compound. Role-based access controls ensure that a department head sees only their team's aggregated data, not individual responses from other groups.
Tooling generally falls into three tiers. Budget-friendly options provide survey templates and basic scoring. Mid-range platforms add NLP text analysis and trend dashboards. Premium or enterprise solutions layer in predictive modeling, demographic segmentation, and deep HRIS integration, connecting sentiment signals to headcount, tenure, and location data for richer analysis.
Integration fit is a selection criterion that's easy to underweight. A sentiment tool that sits outside the platforms employees already use, whether that's Slack, Microsoft Teams, or an HRIS, generates lower response rates and thinner data. Tools embedded in existing workflows capture more organic signal with less friction.
Before selecting any platform, verify four things: anonymization architecture, data residency options, GDPR and SOC 2 compliance, and whether administrators can de-anonymize individual responses. That last point matters most, employees who suspect their responses can be traced back to them will self-censor, which corrupts the data entirely.
Ask vendors to demonstrate, not just assert, how anonymization works at the technical level. These are non-negotiable requirements, not differentiators.
Workplace sentiment analytics converts employee feedback into early warnings, precise interventions, and measurable gains in retention, productivity, and real estate efficiency.
The retention mechanism is time. Sentiment data surfaces disengagement signals, a declining eNPS score, rising negative comment frequency around management or workload, weeks or months before an employee submits a resignation [2]. Exit interviews arrive too late to act on; sentiment analytics creates an intervention window that reactive processes never provide.
That window only has value when the data is segmented. Aggregate scores across an entire organization can mask the teams, locations, or role levels where culture problems are concentrated. A company-wide satisfaction score may hide a specific department sitting far below average, and that department may be the one with the highest replacement cost. Segmentation turns a broad signal into a precise target for corrective action.
Geographic and demographic variation compounds this risk. Sentiment scores often differ significantly by region, generation, or function [3]. Treating the organization as a monolith produces an average that obscures the groups most at risk of leaving, which is why segmentation is a prerequisite for meaningful action rather than an optional refinement.
Aggregate sentiment around in-office days, commute burden, and collaboration quality gives real estate and HR leaders evidence to adjust office policies and space allocation, rather than relying on assumption or anecdote. Platforms like Upflex pair this kind of utilization intelligence with AI-powered attendance forecasting, so space decisions reflect both how employees feel about the office and how often they actually show up.
The feedback loop that sustains long-term ROI is straightforward: organizations that visibly act on sentiment data, communicating what changed as a result of employee feedback, see higher future response rates and more honest input [3]. Each cycle of listen, act, and communicate compounds the value of the analytics investment, making the program more accurate and more trusted over time.
Workplace sentiment analytics breaks down when organizations treat algorithmic scores as ground truth rather than one input among several that requires human interpretation.
High sentiment scores and high attrition can coexist, and often do. An employee who rates their experience positively may still leave next quarter because a competitor offered a significantly higher salary. Sentiment measures current emotional state, not future behavior. Conflating the two produces misplaced confidence in the data and leads teams to miss departures they assumed were impossible.
NLP models compound this problem. Sarcasm, cultural idiom, domain-specific jargon, and code-switching in multilingual workforces all degrade model accuracy in ways that aggregate scores hide. A comment like "great, another all-hands" reads as positive to a basic classifier and negative to anyone who knows the context. Human review of flagged themes remains necessary, algorithmic output is a starting point, not a verdict.
Survey fatigue creates a separate distortion. Organizations that survey employees too frequently see response rates fall, and the responses that remain skew toward employees with strong grievances [2]. The result is a dataset that overstates dissatisfaction. A sustainable listening cadence, typically one pulse survey per quarter supplemented by event-triggered check-ins, keeps participation rates high enough to produce representative data.
The most damaging pitfall is the action gap. Collecting sentiment data without a visible response process erodes trust faster than not collecting it at all. Employees who feel surveyed but ignored become less likely to respond honestly in future cycles, degrading data quality precisely when leadership needs it most.
Anonymous surveys are only anonymous at scale. On a team of six, a response filtered by department, tenure, and seniority can identify the respondent without naming them, a chilling effect that suppresses honest feedback from the people closest to real problems.
Responsible platforms enforce minimum group-size thresholds, typically requiring at least eight to ten responses before displaying disaggregated results, and apply aggregation rules that prevent cross-filtering across multiple demographic dimensions simultaneously. Organizations should audit these settings before deployment and communicate them clearly to employees, trust in the process is a precondition for data quality, not an afterthought.
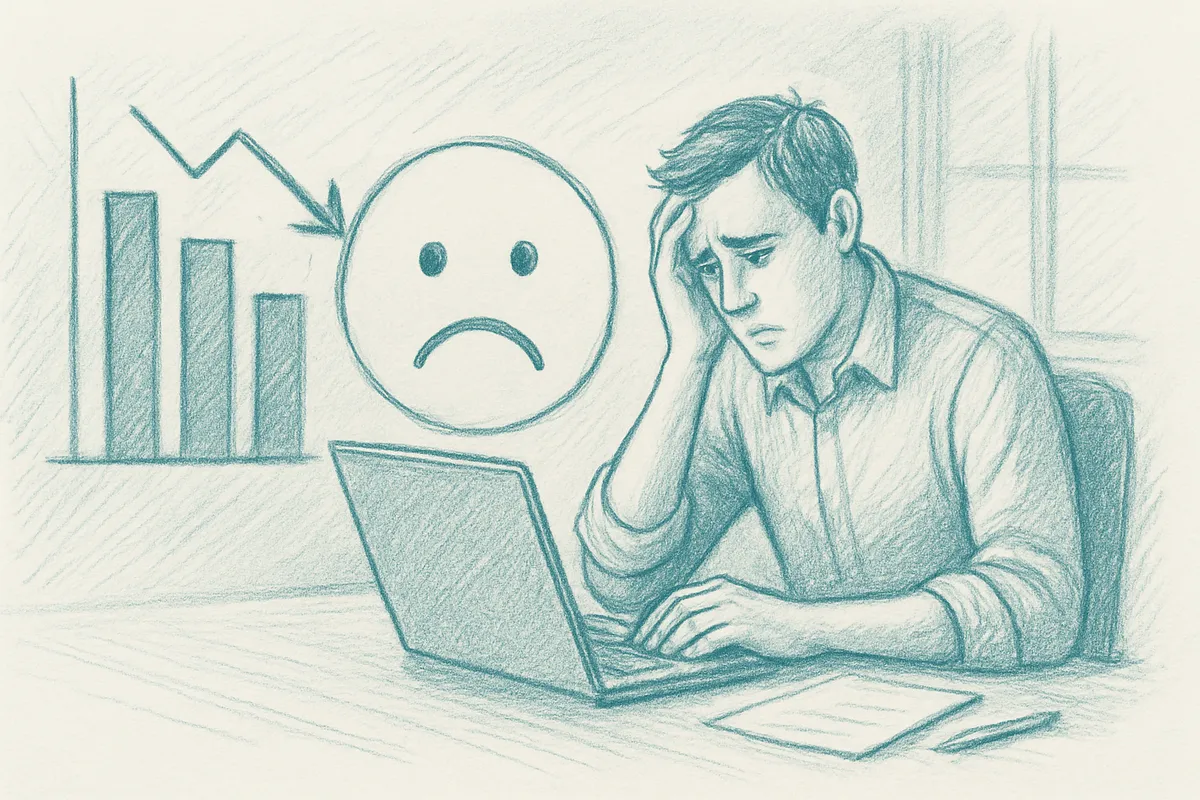
Workplace sentiment analytics is continuous and multi-source, while a standard engagement survey is periodic and single-channel. Traditional surveys run once or twice a year and capture a snapshot; sentiment analytics processes data from multiple inputs, pulse surveys, communication tools, open-text responses, on an ongoing basis. Natural language processing also extracts meaning from unstructured text, giving you nuance that a five-point Likert scale cannot. The result is a real-time picture of workforce mood rather than a historical record.
Most enterprise-grade sentiment platforms support multiple languages, but accuracy varies significantly by language and vendor. Major European languages (Spanish, French, German) and Mandarin typically perform well; lower-resource languages can produce weaker results because the underlying NLP models have less training data to draw from. If your workforce spans multiple countries, test any platform against your specific language mix before committing, don't rely on a vendor's headline language count alone.
Monthly pulse surveys with three to five questions strike the best balance between data freshness and employee tolerance [2]. Annual surveys are too infrequent to catch emerging issues early; weekly check-ins risk fatigue and declining response rates that undermine the data's reliability. Rotating question sets, so no employee answers the same questions every cycle, helps maintain engagement while still building a comparable trend line over time.
Anonymity depends on the platform's design and your organization's configuration, it is not automatic. Most tools aggregate responses and suppress results for groups below a minimum threshold (commonly five to ten respondents) to prevent identification. However, demographic filters such as department, tenure, and location can still narrow results enough to identify individuals in small teams. Employees should be told exactly what data is collected, how it is aggregated, and who can access segment-level reports before they respond.
Sentiment analytics is viable for smaller organizations, but the statistical reliability of the data improves with headcount. Teams of fewer than 50 people often struggle to generate enough responses to produce meaningful segment-level trends without risking individual identification. Smaller organizations typically get more value from lightweight pulse tools with strong qualitative features, open-text prompts and manager conversation guides, than from platforms built around large-scale NLP processing across thousands of responses.
Workplace sentiment analytics delivers value only when three things align: consistent data collection across multiple channels, NLP that goes beyond keyword counting to capture context, and a clear process for turning findings into visible action. Without that last step, even the most accurate sentiment data erodes employee trust rather than building it.
For corporate real estate and HR leaders, sentiment data is also a direct input to space decisions, understanding why employees avoid the office is as important as knowing how often they show up. Pair sentiment findings with attendance data from a platform like Upflex, which forecasts office presence with high accuracy, and you move from guessing to deciding with evidence.
As a concrete next step, audit your current feedback channels this week: list every source of employee input you collect, how frequently it runs, and whether any of it uses open-text analysis. That gap map is your implementation starting point.
Explore more from our content library: