Share This Article
No items found.

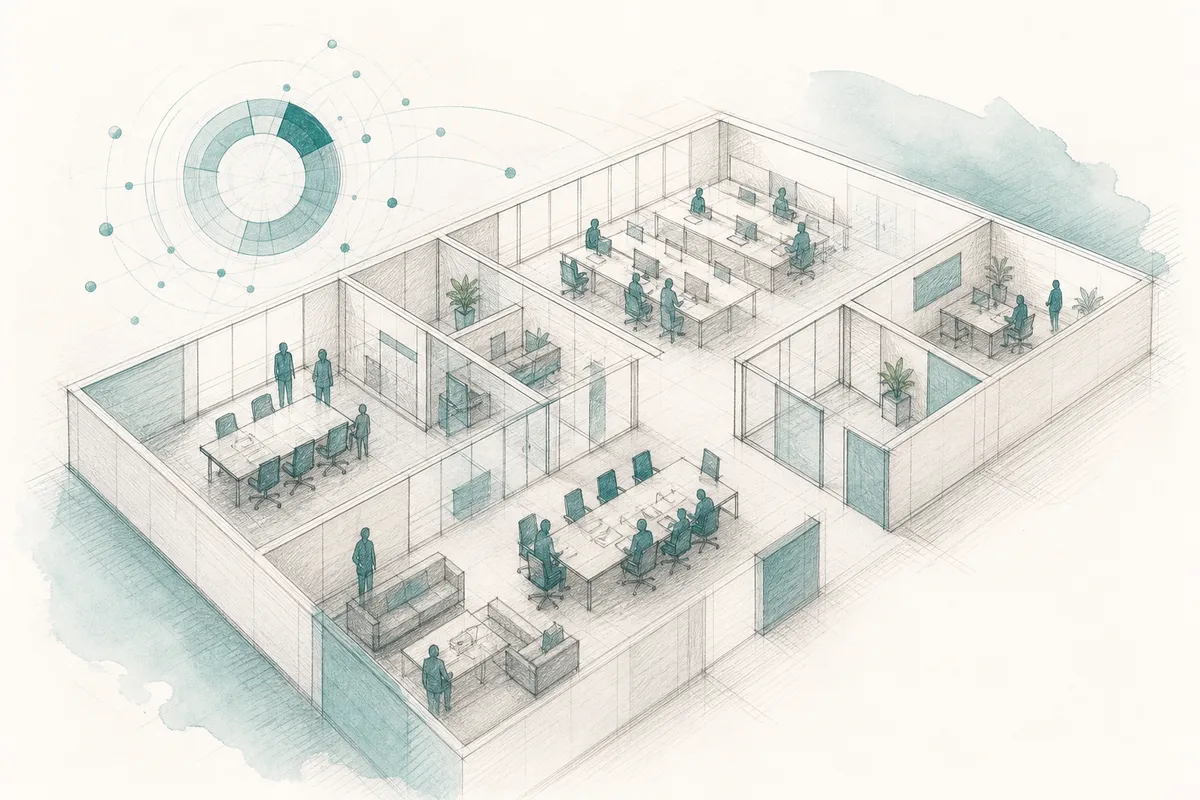
Occupancy intelligence is the practice of collecting, analyzing, and acting on real-time and historical data about how physical spaces are actually used, who is in a building, which desks and rooms are occupied, and when. It moves workplace decisions from gut feel and calendar bookings to verified utilization data. For hybrid organizations, that shift is the difference between paying for space you need and paying for space you assume you need.
This approach to workplace analytics converts raw sensor signals from physical spaces into verified, decision-ready data about real workplace usage, not scheduled or intended usage. For a foundational overview, VergeSense's explainer on occupancy intelligence outlines how the discipline has evolved beyond simple headcounts.
The distinction matters. A desk-booking system tells you who planned to sit somewhere. A badge swipe tells you who entered a building. Neither tells you whether that person was actually at their desk, in a meeting room, or gone by 10 a.m. This data-driven approach closes that gap by capturing verified, real-time presence, so the number you see on a utilization dashboard reflects what actually happened, not what was booked.
Most deployments draw from several sensor types, each measuring a different signal.
No single modality is sufficient on its own. Production deployments typically fuse two or more sensor types to compensate for individual blind spots.
Raw sensor data is noisy, and the pipeline that converts it into insight introduces its own distortions at every stage.
The data flow runs roughly as follows: raw sensor events are collected at the edge, passed to an aggregation layer that batches and timestamps them, normalized against a space map and headcount baseline, fed into an analytics engine, and finally surfaced as dashboard metrics that trigger space or scheduling decisions. Each handoff is a point where calibration errors, missing data, or mismatched assumptions can compound.
Specific accuracy problems include sensor placement, a PIR unit mounted too high or angled incorrectly will under-count. Device-sharing means one laptop used by two people in rotation registers as one occupant. Multi-device users do the opposite, inflating Wi-Fi counts. Calibration drift affects all hardware over time: a CO₂ sensor that read accurately at installation may skew six months later without recalibration.
Honest implementations quantify this uncertainty rather than hiding it, presenting utilization ranges rather than false-precision percentages, and flagging spaces where sensor coverage is incomplete.
This framework works through four sequential pillars: Capture, Analyze, Act, and Iterate — skip one, and the chain breaks.
Capture is where raw signal becomes usable data. Sensors, badge readers, Wi-Fi access points, desk booking systems, and calendar integrations each record a slice of how space is used. No single source is complete on its own, badge data tells you who entered the building, not which floor they worked on.
Analyze is where the decision signal emerges. The metrics that matter most are:
Act is where analysis reaches real estate decisions. Occupancy data directly informs right-sizing floor plates, reconfiguring underused individual desks into collaboration zones, adjusting cleaning schedules to match actual traffic rather than fixed timetables, and building the utilization case for lease renewal negotiations.
Iterate closes the loop. A decision made in Q1, say, converting a quiet floor into an open collaboration area, changes how people use the space in Q2. That new usage pattern requires fresh analysis. This is not a one-time audit; it's a continuous monitoring discipline.
The Analyze-to-Act sequence is where layout decisions get their evidence base [2]. When utilization data shows that meeting rooms sit empty 60% of the day while open desks are oversubscribed on Tuesdays and Wednesdays, the reconfiguration case writes itself. Platforms like Upflex build this feedback loop into their core, UnifyAI forecasts attendance with 97% accuracy, giving workplace teams the forward-looking signal they need before committing to a layout change, not after.

A successful rollout follows a defined sequence: audit infrastructure, set priorities, select sensors, pilot, validate, then scale.
Start by cataloging what you already have, Wi-Fi access points, badge readers, building management systems (BMS), and any existing desk booking data. That audit determines which sensor types fill genuine gaps versus which are redundant. From there, define which decisions the data needs to support first: lease consolidation, space redesign, or team co-attendance tracking. Priorities shape your sensor mix.
Run a pilot on one floor or zone before committing to a full deployment. Validate sensor readings against manual headcounts during the same period. Discrepancies above 10–15% usually point to placement errors or integration gaps, fix them before scaling.
Wi-Fi infrastructure gives organizations a low-cost entry point for space utilization data, devices connected to the network send probe requests that access points can log to estimate presence [3]. The Innerspace blog on spatial intelligence beyond occupancy sensors explores how organizations are moving past Wi-Fi-only approaches toward richer data fusion.
The ceiling on this approach is real. A connected device is not a confirmed person: one employee may carry a laptop and a phone, while a visitor with no device goes undetected. Privacy regulations in many jurisdictions also restrict MAC address tracking, which limits granularity. Wi-Fi data works best as a directional signal, useful for floor-level trends, rather than a precise desk-level count.
Four failure modes account for most derailed rollouts. First, sensor placement errors create blind spots, a motion detector mounted too high or angled incorrectly misses entire zones. Second, integration failures between the occupancy platform and the IWMS or HR system leave data siloed, so the insights never reach the people making portfolio decisions. Third, data governance gaps mean no one owns the occupancy dataset: it goes stale, inconsistencies accumulate, and trust in the numbers erodes. Platforms like Upflex address this by consolidating utilization data into a single dashboard, giving corporate real estate teams a clear data owner and a single source of truth.
The fourth pitfall is change management, and it's the one most vendor documentation skips. Employees who believe sensors monitor their individual behavior will actively avoid sensor zones, corrupting the dataset at its source. Transparent communication about what is and isn't tracked, aggregate counts, not individual surveillance, is a prerequisite for accurate data, not a nice-to-have. Organizations that publish a clear data-use policy before deployment consistently see higher compliance and cleaner occupancy readings than those that deploy quietly and explain later.
Occupancy intelligence drives financial return through four cost levers: real estate consolidation, lease renegotiation, facilities rightsizing, and capital expenditure avoidance.
The largest lever is real estate consolidation. When utilization data confirms that one floor, or an entire building, consistently runs below viable occupancy thresholds, that evidence supports a decision to exit the lease rather than debate it. The second lever is lease renegotiation: verified utilization data gives your real estate team a defensible position when approaching landlords about reduced square footage or amended terms. Platforms like Upflex document utilization patterns over time, producing the audit trail that makes those conversations credible.
Facilities cost reduction is the third lever. Cleaning schedules, HVAC runtime, and security staffing are typically set for peak occupancy, not actual occupancy. Aligning those services to real attendance patterns cuts operating expenditure without touching headcount. The fourth lever is capital expenditure avoidance: when data shows existing space is sufficient, you can delay or cancel a planned expansion rather than sign a lease you may regret.
Start by establishing two baselines: your current cost-per-seat and your current utilization rate. Then model the cost reduction from closing the gap between that rate and an optimized target, typically by reducing the total seat inventory you pay for. Subtract platform and implementation costs from the projected saving, then divide the net saving by total investment to arrive at a payback period.
Payback periods vary significantly. An organization already running high utilization has less slack to recover than one carrying substantial underused inventory, the math simply produces a smaller numerator. Lease structure matters too; a company mid-lease captures savings later than one approaching renewal.
Indirect ROI, reduced friction in hybrid scheduling, faster facilities response, better employee experience, is real but harder to quantify. The mechanism is straightforward: when employees can reliably find a desk and their team is present on the same day, commute trips become more purposeful, which supports attendance consistency over time. Upflex tracks co-attendance achievement at an 88% benchmark rate, which gives HR leaders a concrete metric to present alongside the financial case.
The right platform depends on your sensor infrastructure, integration requirements, and the data privacy controls your legal team will accept. Industry research such as the Occupancy Intelligence Index, 4th Edition from the SSO Network provides benchmark data on how organizations are currently deploying and measuring these systems.
Platforms fall into three broad tiers. Entry-level tools rely on Wi-Fi probe data or basic motion sensors and deliver building-level headcounts with limited analytical depth, adequate for simple utilization reporting, insufficient for space redesign decisions. Mid-range platforms fuse multiple sensor types (badge readers, desk sensors, thermal arrays) to produce zone-level analytics and typically offer connectors to common IWMS and HR systems. Enterprise platforms add computer vision, people-flow modeling, and predictive analytics through API-first architectures that push data into your existing BI environment in real time.
Before shortlisting any platform, ask four integration questions: Does it connect to your IWMS, HR system, or workplace app? Can it export to your BI tool without a custom build? What is the data latency, real-time, near-real-time, or batch? And does the vendor's data model match the granularity your decisions actually require? Upflex, for example, pairs occupancy data with its UnifyAI attendance forecasting engine to produce predictions at 97% accuracy, a level of analytical depth that entry-level sensor tools alone cannot reach.
The critical distinction is between anonymous aggregate data, headcount by zone at a given hour, and personally identifiable data, such as tracking a named individual's location across the day. GDPR and equivalent frameworks treat these very differently, and your platform's data model determines which regime applies to you.
Responsible platforms reduce regulatory and employee-relations risk through three technical controls: edge processing (data is analyzed on-device before any transmission, so raw video never leaves the sensor), MAC address randomization (device identifiers are hashed or discarded rather than logged), and defined data retention limits that purge records after a set period.
Privacy architecture should be a procurement criterion evaluated alongside analytics capability, not a legal checkbox added after contract signature. A platform that sends raw video feeds or persistent device IDs to the cloud creates both a compliance exposure and a trust problem with employees whose buy-in your hybrid program depends on.
Space utilization tracking records how often a space is used; occupancy intelligence explains why, predicts future patterns, and recommends action. Utilization data tells you that a floor ran at 40% capacity last Tuesday. This deeper analytical layer adds team schedules, collaboration patterns, and attendance forecasts to tell you whether to consolidate that floor, reconfigure it, or redirect employees to an on-demand workspace, turning a backward-looking metric into a forward-looking decision.
Yes, this approach is designed specifically for unassigned, activity-based environments where presence is unpredictable. Sensor data, booking signals, and scheduling inputs combine to map real demand against available supply each day. Platforms like Upflex use AI-powered attendance forecasting to predict who will come in and when, so space can be allocated dynamically without fixed assignments driving the logic.
Deployment timelines vary by sensor type and integration complexity, but most enterprise rollouts reach baseline data collection within four to twelve weeks. Software-only configurations that rely on existing Wi-Fi, badge readers, or calendar integrations tend to go live faster than projects requiring new sensor hardware. Full portfolio-level insight, enough to support real estate decisions, generally requires at least one full quarter of clean data.
Many systems can start with existing infrastructure, Wi-Fi access points, access control systems, and calendar data are common starting points [3]. Dedicated sensors (PIR motion detectors, thermal cameras, desk-level pucks) add granularity but are not always required for a first deployment. The practical approach is to audit what data sources you already have, identify the gaps in spatial resolution, and add hardware only where the decision value justifies the cost.
Verified space utilization data enables facilities teams to align HVAC, lighting, and other building systems with actual occupancy rather than fixed schedules. When sensors confirm that a floor is consistently empty on Fridays, energy systems can be scaled back automatically, reducing consumption without affecting employee comfort. This connection between space data and building performance is increasingly recognized in commercial building energy efficiency guidance as a practical path to measurable carbon and cost reduction.
Occupancy intelligence closes the gap between the office you're paying for and the office your teams actually use. Three things are worth acting on now: first, audit your current data sources, badge readers, calendars, booking logs, because you likely have more raw signal than you're using. Second, prioritize attendance forecasting alongside sensor data; knowing when people will arrive is as important as knowing how many showed up yesterday. Third, treat space decisions as continuous rather than annual, the organizations reducing real estate spend most aggressively are running this analysis every quarter, not every lease cycle.
A practical next step: map one floor or office location against three months of booking and badge data, identify the peak and trough days, and calculate the cost per actually-used desk. That single exercise usually makes the case for a full deployment on its own.
Explore more from our content library: