Share This Article
No items found.


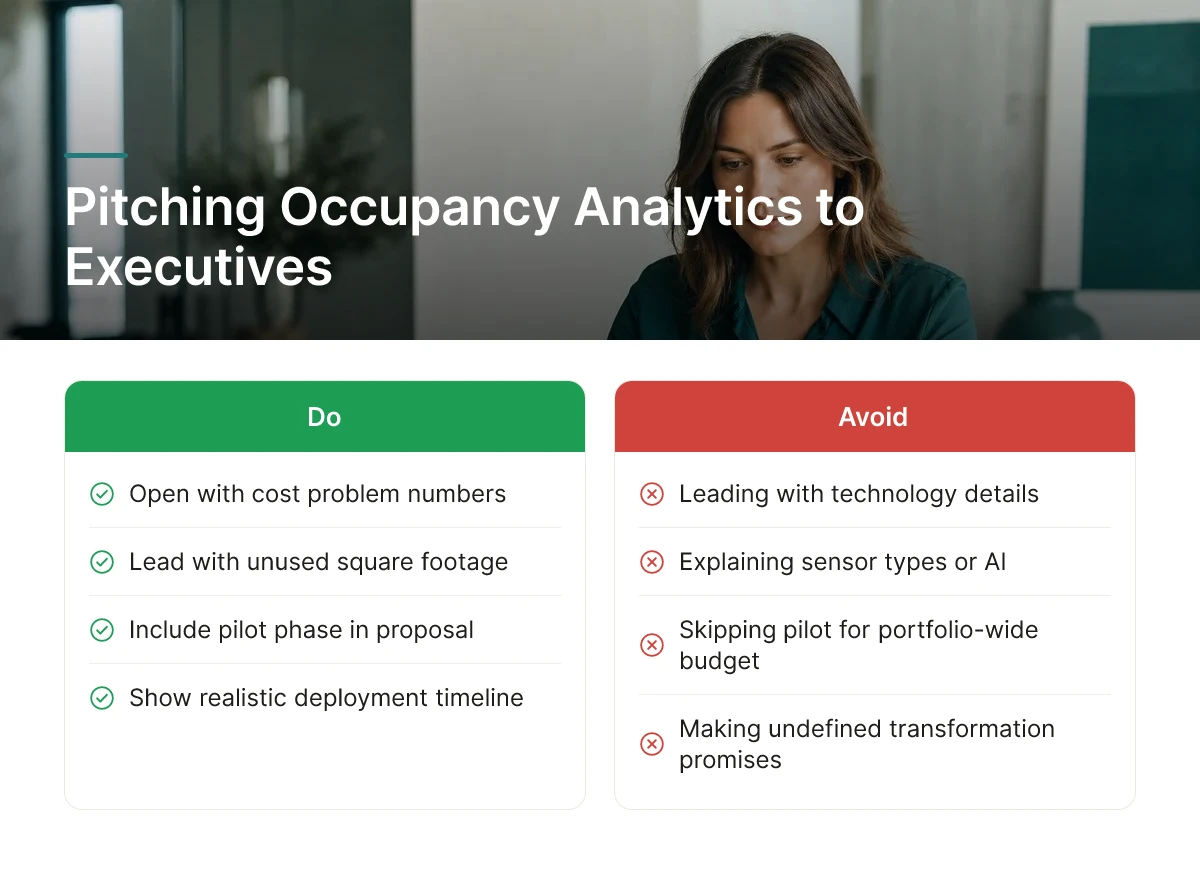
Executive buy-in for occupancy analytics software comes from tying utilization data directly to real estate decisions leadership already cares about: lease renewals, consolidation, and headcount planning. The strongest business case pairs a baseline utilization measurement with a concrete cost mechanism, unused square footage carries rent, utilities, and maintenance costs whether or not anyone sits there. Build the case in the language finance already uses: cost per occupied seat, not cost per employee. Present a phased pilot with a clear before/after comparison instead of a company-wide rollout, so leadership sees evidence before committing further budget.
Before building a business case for occupancy analytics software, assemble four inputs: baseline space data, the right stakeholders, a single pilot site, and the decision criteria finance will apply.
Start with the numbers that already exist in lease files and HR systems. Pull current lease terms and renewal dates for each site, square footage by floor or building, headcount compared against seat count, and any badge-swipe or calendar data already being collected. Most corporate real estate teams have some version of this data scattered across property management, HR, and IT systems, the work is consolidating it into one view before asking for new occupancy analytics software to analyze it.
Loop in three groups early rather than after the pitch is built:
Scope the first ask to one pilot site or a single floor, not the whole portfolio. A phased, hybrid-workforce rollout is a recognized best practice precisely because occupancy and utilization needs vary by location and team, and a narrower pilot gives leadership evidence before committing budget across every site [1]. A single floor also limits disruption if the rollout needs adjustment, which matters because minimizing disruption to employees is one of the criteria executives weigh alongside payback period and the burden of integrating new tools with existing badge, calendar, or IWMS systems [1]. These same portfolio tradeoffs are echoed in broader corporate real estate strategy research for hybrid organizations [2]. Finally, write down the decision criteria before the meeting, not during it: how fast does this pay back, how much does it disrupt daily work, and how heavy is the integration lift. Executives evaluating any new technology investment ask some version of these same questions, whether the request involves occupancy analytics software or a larger IT budget [4]. Knowing the answers in advance turns the pitch from a request into a recommendation. The same groundwork, framing the ask around numbers the budget owner already tracks, applies whether you are pitching real estate technology or any other data-driven investment seeking executive sign-off [5].
Occupancy analytics software reduces real estate costs by exposing the gap between the space you lease and the space your employees actually use, then turning that gap into a dollar figure finance can act on. Every underused floor still carries full rent, utilities, janitorial contracts, and maintenance regardless of whether anyone sits there. That gap is the budget line hiding in plain sight.
Hybrid schedules make the gap worse, not better. Occupancy swings day to day, a floor that's packed on Tuesday can sit nearly empty on Friday, and most legacy lease decisions were made assuming steady five-day attendance [1]. Without real utilization data, facilities teams are planning capacity against a headcount number that no longer reflects how people actually show up.
Start with the gains employees already feel, because they're the easiest to validate without a full lease cycle. Fewer overflow complaints on anchor days, more accurate room and desk booking, and a hybrid policy backed by attendance data instead of a manager's guess are all wins you can report within a single quarter.
These are the proof points that earn trust before you ask leadership to sign off on anything structural.
Utilization data turns a vague sense that "the office feels empty" into a specific, defensible footprint decision. If a floor runs below 30% utilization for a sustained period, that's a consolidation candidate, not a renovation candidate. A lease up for renewal in twelve months becomes a renegotiation lever the moment you can show the landlord or your own CFO the actual demand curve rather than the badge-swipe headcount.
Translate the finding into cost-per-occupied-seat, not cost-per-employee. Cost-per-employee assumes everyone uses a desk every day; cost-per-occupied-seat reflects what the space actually delivers, and it's the metric finance teams already use to evaluate other underutilized assets. A portfolio that looks efficient on a per-employee basis can look wasteful once you run it per occupied seat.
Separate the quick win from the long game. Eliminating a single underused floor or consolidating two half-empty offices into one is a near-term cut you can execute within a lease cycle. Building a multi-year footprint strategy, pairing a smaller owned portfolio with on-demand workspace access for distributed employees, is the durable play, a direction consistent with the corporate real estate strategies many hybrid-first organizations are now pursuing [3]. Upflex supports both: UnifyAI forecasts attendance with 97% accuracy to flag which floors to cut now, while its on-demand workspace network gives displaced employees flexible access elsewhere, supporting the documented pattern of 40%+ real estate savings among organizations that execute full footprint consolidation. For more information, see Ai Seo Software Complete Guide To Tools Platforms 2026.

Compare occupancy analytics software on four criteria, data source, reporting granularity, integration effort, and whether it answers space-planning or scheduling questions, before building any cost case for the executive team.
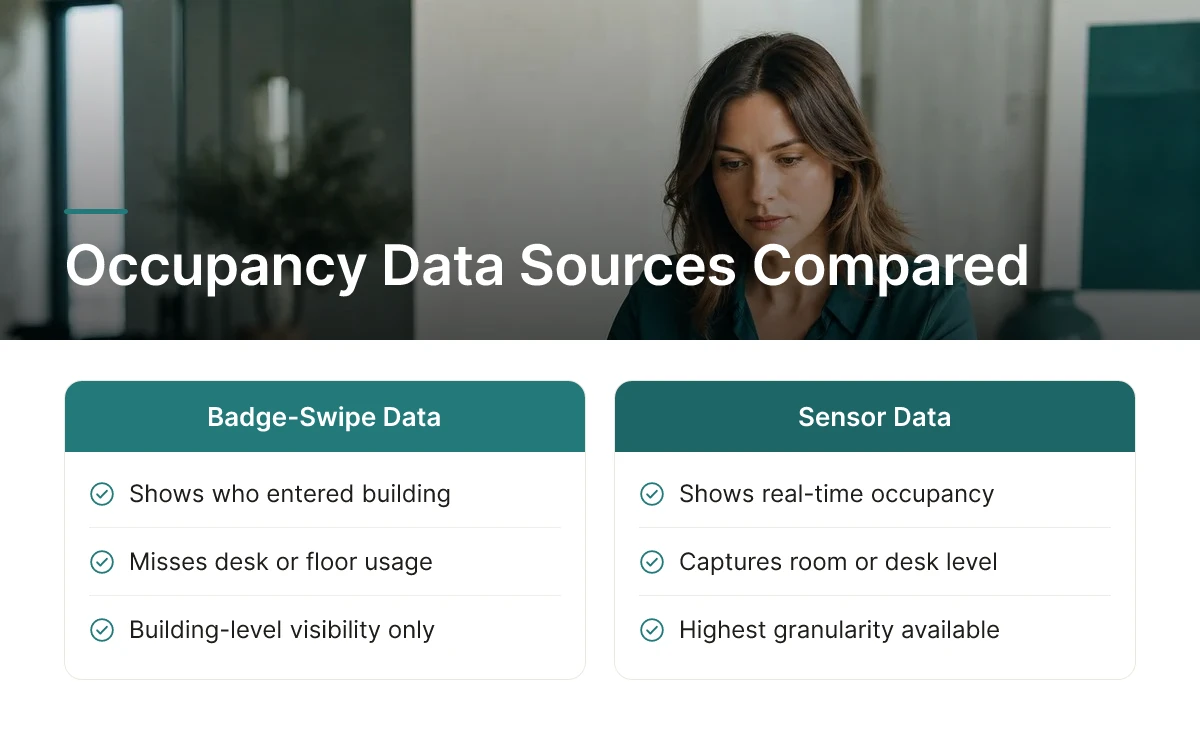
Start with data source type. Badge-swipe data tells you who entered a building, not which desk or floor they used; calendar data tells you intent, not actual presence; sensor data tells you real-time occupancy at the room or desk level. Each has a different cost and a different blind spot, so match the data source to the decision you're trying to make.
WiFi-based tracking is the cheapest option because it reuses network infrastructure you already have, but it measures device presence, not occupancy, a phone connected to WiFi doesn't confirm a person is sitting at a desk. IoT sensors mounted under desks or in ceiling tiles give much higher per-desk accuracy because they detect physical presence directly, though installing and maintaining them across a large portfolio adds real cost. Video-based systems offer the richest detail, headcounts, dwell time, traffic flow, but they trigger privacy and legal review in most jurisdictions and with most workforce councils, which can slow a rollout by months.
Once you've shortlisted two or three vendors, build a qualitative ROI model rather than a single guaranteed number. Line up the current cost of carrying underused square footage against a budget-friendly, mid-range, or enterprise-tier occupancy analytics software investment, and frame payback not as a fixed timeline but as a function of how fast the data lets you make a consolidation or lease decision. Workplace strategy research consistently points to flexible space and regular usage review as the levers that keep real estate costs aligned with actual demand [1].
The strongest evidence for your pitch won't come from a vendor's published averages, it will come from your own pilot. Run the chosen platform in one or two buildings, capture utilization before and after, and use that internal before/after comparison as the anchor of your business case; it's harder for a CFO to dismiss than a case study from a company in a different industry. Upflex's own benchmark data, 97% attendance forecast accuracy and documented 40%+ reductions in real estate spend, illustrates the scale of outcome a well-matched platform can produce once UnifyAI forecasting is paired with desk booking and on-demand workspace access. Finally, make sure the occupancy analytics software you pitch matches the goal you stated to leadership: a platform tuned for day-to-day desk booking won't give the CFO what's needed for a lease-renewal decision, and a space-planning tool alone won't fix an HR leader's co-attendance problem.
Roll out occupancy analytics software in a phased pilot, validate the data before trusting it, then expand site by site based on what the pilot proves.
Deployment speed is itself part of the pitch to executives. A leader who can say "we'll have signal in six weeks, full rollout in two quarters" earns more trust than one who promises an undefined transformation. Build the plan around three phases: pilot, validation, expansion.
Expect early signal from a single-site pilot within weeks, but full integration and change management across a global portfolio typically takes several months.
Set that expectation with executives before the project starts, not after the first delay. A pilot answers "does this work here," while a full rollout answers "can we trust this for portfolio-wide decisions", those are different questions with different timelines. Deployment complexity scales with three factors: the number of systems you're connecting, whether new hardware needs to be installed, and how long IT and security review takes for data access approvals. A company with one badge system and no sensor hardware to install will move faster than one coordinating five regional access-control vendors and a security review board. Upflex's own forecasting layer, UnifyAI, is built to reach 97% attendance forecast accuracy using scheduling and utilization inputs organizations already have, which shortens the path from pilot to a defensible answer for leadership.
The platform pulls entry data from badge or access-control systems, meeting and desk context from calendar tools, and space data from workplace management software.
Three integration points matter most. Badge and access-control systems supply the raw entry and exit timestamps that anchor actual occupancy. Calendar systems, Microsoft 365 or Google Workspace, per the earlier audience profile, add context on which days are meeting-heavy versus focus days, and tie desk bookings to real usage. Workplace management tools round out the picture with floor plans and space allocation data, so utilization numbers map to specific zones rather than a single building-wide average. Fewer integration points and no new hardware mean a faster pilot. A legacy IWMS already in place can add review time, since IT and security teams need to approve new data-sharing paths before access data moves between systems [1].
Most occupancy analytics software pitches fail for the same five avoidable reasons, not because the underlying business case is weak.
Watch for these errors before the proposal reaches a budget committee.
These mistakes compound. A pitch that leads with sensors, skips the pilot, and sidesteps legal review rarely survives a second meeting, regardless of how strong the underlying data turns out to be. Sequencing the pitch correctly, problem, pilot, governance, validated numbers, decision fit, is usually what separates a funded initiative from one that gets tabled "until next quarter."
Real-time occupancy data comes from a mix of badge swipes, Wi-Fi connections, desk and room sensors, and booking system logs. Platforms like Upflex combine scheduling inputs with workplace utilization data through its UnifyAI engine to forecast attendance with 97% accuracy, rather than relying on a single sensor type. Visitor data typically layers in through reception or visitor-management integrations feeding the same dashboard.
Track peak-day occupancy versus average daily occupancy, desk-to-employee ratios, and co-attendance rates by team. Most organizations see utilization data shift from guesswork to a documented baseline within the first full reporting cycle. Upflex customers use this baseline, including 88% co-attendance achievement benchmarks, to justify portfolio consolidation decisions to finance leadership.
Start with your current cost per square foot, multiply by underused square footage identified in utilization reports, then model the savings from subletting, consolidating, or not renewing a lease. Factor in avoided costs too, such as skipped expansions. Upflex's portfolio optimization reporting has supported documented outcomes of 40%+ reduction in real estate spend for customers consolidating owned office space around verified attendance patterns rather than assumptions.
Yes, some platforms focus narrowly on desk booking, others on portfolio-level real estate analytics, and few combine both with external workspace access. Legacy real estate suites offer deep compliance reporting but weak hybrid coordination; point solutions cover one pain point but lack breadth across forecasting and space access.
Ownership usually sits with corporate real estate or workplace strategy, but the strongest pitches are co-authored with finance and HR from the start. Finance validates the cost-per-seat model and payback logic, while HR confirms the data supports hybrid policy decisions rather than undermining employee trust. A single owner who consults these groups early moves faster than one who builds the case alone and seeks sign-off afterward.
Building the case for occupancy analytics starts with data, not opinion: a documented utilization baseline, a clear cost-per-square-foot model, and attendance forecasts your CFO and CHRO can both trust. Treat the first reporting cycle as your evidence-gathering phase, then translate underused square footage directly into consolidation or sublease scenarios. Platforms that pair forecasting with flexible workspace access, like Upflex, give you room to right-size without mandating rigid schedules.
Next step: pull your last 90 days of badge or booking data and calculate your actual peak-day utilization rate before your next lease renewal conversation.
Explore more from our content library: