Share This Article
No items found.


A hybrid work cost analysis often undercounts the real financial picture because it stops at rent-per-square-foot and misses costs that shift rather than disappear. Technology upgrades, cybersecurity, home-office stipends, collaboration tool licensing, management overhead, underused real estate, and culture or onboarding friction all offset headline savings. A complete analysis tracks what hybrid work removes from the budget alongside what it quietly adds elsewhere, so the net figure, not the gross real estate cut, is what should drive office decisions.
Distributed work turns every home into a network endpoint, and a proper hybrid work cost analysis has to price that exposure, not just square footage saved. VPN licenses, endpoint security agents, and identity management tools scale with device count across every laptop, phone, and tablet touching company data, not with how many people fit in one building.
Cybersecurity risk climbs when employees connect from home routers and shared networks instead of a controlled office firewall. That pushes spend toward continuous monitoring, threat detection, and incident response capacity that a single-location company rarely needed at the same scale.
Treat this as a recurring operating line, not a one-time IT setup project. Licenses renew annually, threat models evolve, and monitoring tools need continuous tuning as the device fleet grows.
This tier matters most for companies that ran on-premise-only security for years and are now retrofitting cloud-based protection for a distributed workforce. The differentiator finance teams miss: size this cost against the number of access points and locations in play, not headcount, a 2,000-person company with 40 satellite locations and home offices carries a very different security bill than the same headcount in one building.
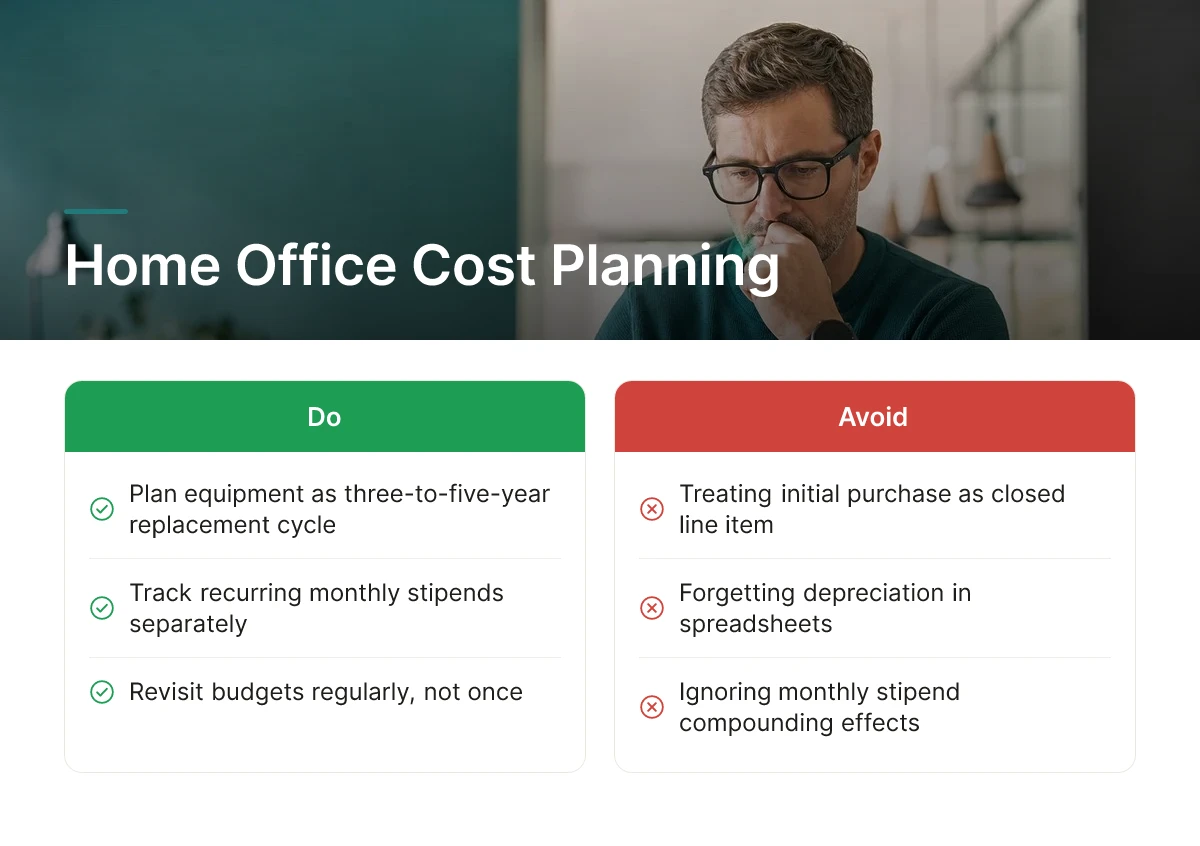
Home office equipment and stipends create both one-time and recurring costs that most budgets only plan for once and never revisit.
Desks, monitors, and ergonomic chairs are capital purchases, paid once, then forgotten in spreadsheets. Internet and utility stipends are different: they recur monthly, and they quietly compound across a distributed headcount over a fiscal year.
Equipment depreciates. Chairs wear out, monitors fail, laptops age past warranty, and most models treat the initial purchase as a closed line item rather than a three-to-five-year replacement cycle that resets on a schedule.
This cost tier matters most for companies with fully remote or majority-remote hybrid populations, where equipment sees daily use, versus teams that come in occasionally and share office hardware. The differentiator here is equity, not just equipment: inconsistent stipend policies across teams or regions create hidden HR friction and retention risk that standard cost models never line-item, even though they show up later as attrition.
Idle square footage under a signed lease keeps costing full price even when daily attendance never fills the room.
Lease terms are fixed for years; daily attendance is not. A company that downsizes by 20% but sees attendance swing between 30% and 60% occupancy day to day still pays for space nobody uses most of the week [3]. Occupancy data exposes the gap between what's contracted and what's actually occupied, a gap traditional cost models based on headcount or square footage per employee don't surface.
This matters most for companies mid-lease or locked into multi-year commitments who can't downsize on demand. The correction isn't lease renegotiation alone, it's pairing desk booking data with occupancy rate tracking so real estate decisions reflect actual use, not contracted capacity. Upflex's forecasting layer, built to predict attendance with 97% accuracy, is designed specifically to close that gap before the next renewal decision.
Manager and operations time spent coordinating hybrid schedules is real labor cost that never appears on a real estate ledger.
Manual scheduling, chasing down who's in which day, reconciling team calendars, resolving double-booked conference rooms, consumes manager hours that a hybrid work cost analysis should count as overhead, even though it shows up nowhere near the facilities budget. Meeting friction compounds this: coordinating in-person collaboration days across departments with different schedules often takes repeated back-and-forth before a team actually lands in the office together.
This overhead grows with organizational complexity, making it most acute at mid-size and large companies running multiple departments that need synchronized in-office days. The lever that actually reduces it, one most competitor pages mention only in passing, is forecasting accuracy. When attendance predictions are reliable enough to plan around, coordination stops being a manual, recurring tax on manager time.
Inconsistent hybrid policies drive attrition, and replacing staff costs far more than any real estate line saves. For more information, see Traditional Seo Agencies Complete Guide Analysis 2026.
When flexibility is unevenly applied or mandates feel arbitrary, employees leave, and every departure carries recruiting cost, training time, and a ramp-up period before a replacement reaches prior productivity. Onboarding itself gets harder in hybrid settings: new hires without structured in-person touchpoints take longer to build the working relationships and institutional knowledge that used to happen by osmosis in a shared office.
This risk is sharpest for companies competing in tight talent markets, where flexibility functions as a retention lever rather than just a cost line to trim. The differentiator a complete hybrid work cost analysis should capture: retention is quantifiable, not a soft HR talking point. Run the math on headcount-replacement cost against any real estate savings from a rigid mandate, and the attrition offset frequently erases the gain, which is why coordination tools that support flexible, predictable in-office days protect savings rather than undercut them.

Productivity loss shows up as slower project delivery and rising absenteeism, and it is the hardest hybrid cost to put a dollar figure on. The mechanism is straightforward: employees lose time re-establishing context when they switch between home and office, and unclear expectations about when collaboration should happen compound the drag.
Most finance teams rely on proxy metrics rather than a direct measurement. Project completion time against baseline, absenteeism rate, and trends in engagement survey scores are the three most common stand-ins for lost output. A widening gap between planned and actual sprint velocity, or a steady decline in survey questions about workload sustainability, both signal rising cost even before turnover data confirms it.
This cost category applies most to knowledge-work teams, engineering, product, marketing, strategy, where output isn't counted in units produced or tickets closed. Transactional roles with clear throughput metrics are easier to monitor and less prone to hidden drag.
Treat this as a two-sided cost. Under-collaboration from too many isolated remote days drives disengagement and slower problem-solving, while over-correcting into meeting-heavy hybrid schedules creates its own burnout from coordination overload. A hybrid work cost analysis that only checks for one side will miss the other.
Culture erosion costs money through slower skill development, longer onboarding ramps, and weaker cross-team problem-solving as co-location declines.
The mechanism is informal and easy to overlook: mentorship and knowledge transfer have historically happened through proximity, a junior analyst overhearing how a senior colleague handles a client objection, or a new engineer getting a five-minute hallway explanation instead of a scheduled call. When teams rarely sit together, those moments disappear, and newer employees take longer to reach full competency.
This cost hits hardest in organizations with apprenticeship-style roles, law, consulting, investment banking, technical engineering, and in any company that depends on cross-team collaboration to move work forward. Time-to-competency for new hires is the clearest financial signal; if it's stretching from three months to five, that's a real labor cost even though it never appears on a real estate line item.
Deliberate space planning can partially offset this erosion, which most cost analyses miss. Activity-based working, designing office zones specifically for mentorship, pairing, and informal collision rather than generic open seating, gives in-office days a clearer purpose and recovers some of the knowledge transfer that remote-first scheduling erodes.
The weight of each hidden hybrid cost depends heavily on sector and company size, which is why no single cost template applies to every organization.
Regulated industries like healthcare and finance carry compliance and data security costs that dominate their hybrid work cost analysis, secure remote access, audit trails, and physical document handling all add expense that a tech company rarely faces. Technology companies, by contrast, see coordination and culture costs dominate: distributed engineering teams spend more on collaboration tooling and lose more to the kind of informal knowledge transfer erosion described above.
Small companies often lack enough real estate footprint to generate large absolute savings from downsizing, cutting one floor of a ten-person office doesn't move the needle the way consolidating a 500,000-square-foot portfolio does. They also carry lower technology overhead, since fewer licenses and simpler infrastructure mean smaller hidden costs to track.
Enterprise organizations see the inverse: larger absolute savings from portfolio consolidation, but also larger absolute exposure to hidden costs like productivity loss and culture erosion simply because more employees and locations are affected by every decision. Use this as a benchmarking lens, a case study from a different industry or size tier may not transfer to your situation, so weight each hidden cost category by your own compliance burden, headcount, and real estate footprint rather than a generic industry average.
Transition costs, lease exits, space reconfiguration, and new technology rollout, land upfront and delay the point where hybrid work actually becomes net-positive.
The mechanism is sequencing: early termination fees on existing leases, construction costs to reconfigure space for hot-desking, and the rollout of booking or forecasting software all hit the budget before utilization drops enough to realize savings. The realistic timeline is shaped like a dip, the first several months typically show a net spend increase, with savings accumulating only once the restructuring is actually complete.
Budget for lease exit penalties or sublease marketing costs, physical reconfiguration of the remaining space, device and software provisioning for remote-capable work, and change management time from HR and facilities staff. This path suits companies planning a phased downsizing, closing one floor or one satellite office at a time, more than an organization attempting an immediate full transition.
Forecasting-driven planning shortens the time to net-positive ROI more reliably than a flat payback-period estimate. Knowing which days and which teams will actually need space lets you time lease decisions and reconfiguration work to when utilization data confirms it's safe, rather than guessing at a fixed break-even date.
Start with occupancy and attendance data, then layer in technology, HR, and productivity costs, and repeat the review quarterly rather than once.
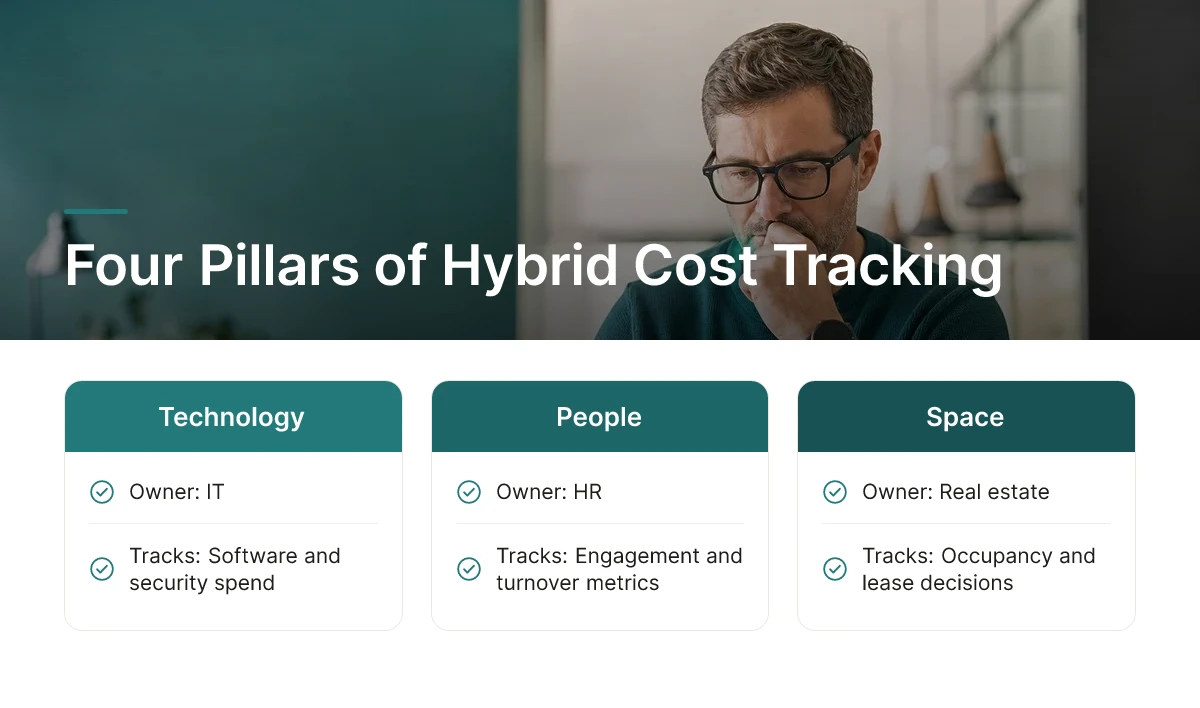
Technology, people, space, and culture costs each need a named owner and a tracking cadence, IT for software and security spend, HR for engagement and turnover metrics, real estate for occupancy and lease decisions, and workplace experience for culture and collaboration signals. A hybrid work cost analysis that treats these as a one-time snapshot understates the real impact, because utilization patterns, attrition, and tool sprawl all shift quarter to quarter. Build it as a recurring review, not a single calculation to present once to the board.
Prioritize which hidden costs to measure first based on your own risk profile: regulated industries start with compliance and security exposure, consulting and engineering-heavy organizations start with culture and training erosion, and smaller companies focus on technology overhead before worrying about real estate consolidation.
Align any lease or downsizing decision with actual occupancy data before signing new commitments. Platforms like Upflex pair desk booking with AI-based attendance forecasting, built to reach 97% accuracy, so real estate decisions are based on where teams actually show up rather than where policy says they should. That data discipline, paired with clear ownership across the four cost pillars, turns a one-off estimate into a repeatable process.
Traditional analyses miss utility waste on empty floors, IT and software duplication across home and office setups, and collaboration losses from mistimed in-office days. They also skip onboarding friction for remote hires, turnover tied to poor hybrid experience, and the productivity drag of proximity bias [1]. Most budgets track lease and headcount costs only, leaving these operational and people-side expenses invisible until they compound.
Most organizations see net-positive savings within 12 to 18 months, though the timeline depends on lease terms and how fast space gets consolidated. Early phases often carry added technology and collaboration-tool spend that offsets real estate savings [2]. Companies that pair attendance data with consolidation decisions, rather than guessing at footprint cuts, tend to reach breakeven faster because they avoid downsizing too much or too little.
Track occupancy rate, peak-day attendance, co-attendance against team targets, cost per employee per square foot, and desk-to-employee ratio. Also monitor employee satisfaction and turnover, since cost cuts that damage the in-office experience often resurface as hiring and retention expenses [1]. Upflex customers track these alongside its 88% co-attendance benchmark, which ties coordination performance directly to real estate decisions rather than treating the two as separate reports.
Yes, attendance forecasting lets you model savings before signing any lease changes or cutting square footage. Running forecasts against current utilization shows which floors or buildings are consistently underused, so leaders can size a consolidation plan with data instead of assumption. Upflex's UnifyAI engine forecasts attendance at 97% accuracy, giving finance and real estate teams a defensible number to bring into lease-renewal negotiations.
Desk booking data reveals actual occupancy patterns, and occupancy patterns determine whether your real estate footprint is sized correctly. Low utilization on booked desks signals excess square footage costing money with no offsetting value, while consistently high booking rates on fewer floors justify consolidation. Real estate ROI improves when booking data, not headcount alone, drives the downsizing decision.
A hybrid work cost analysis only holds up when it accounts for utility waste, duplicated technology spend, and the collaboration costs of mistimed office days, not just rent and headcount. Pair attendance forecasting with real utilization data before cutting square footage, and track co-attendance alongside cost per square foot so downsizing doesn't damage the in-office experience you're trying to protect. Organizations that get this right typically reduce real estate spend by 40%+ without resorting to rigid mandates. Start by pulling your last 90 days of desk booking data and comparing it against your current footprint, the gap between booked and used space is usually where the first savings hide.
Explore more from our content library: