Share This Article
No items found.


A healthy office space utilization rate today typically falls between 60-80% for hybrid teams, measured as the share of available desks or rooms actually occupied during working hours against total capacity. This differs from occupancy rate, which only counts how many seats are filled at a single snapshot in time rather than patterns across days, weeks, or space types. Most companies track utilization through sensors, badge data, or booking system logs, then use the gaps to right-size their real estate footprint and cut unused square footage from the lease.
Utilization measures actual usage against available capacity over time, while occupancy is a headcount snapshot at a single moment, the two answer different questions entirely.
Office space utilization rate tracks how a desk, room, or floor gets used across a workday, week, or quarter, not just whether someone is sitting in it right now. Occupancy, by contrast, tells you how many seats are filled at 10 a.m. on a given Tuesday. Skedda describes occupancy as "the number of people physically present in a space at a given time," while utilization reflects "how efficiently and effectively a space is used over time" [1]. Confusing the two is how real estate teams end up paying for square footage that looks busy on paper but sits empty in practice.
Occupancy alone hides the patterns that actually drive cost decisions. A room booked for a 9 a.m. meeting that nobody cancels, or a desk assigned to an employee who comes in twice a week, both register as "occupied" in a badge-swipe count, even though the real utilization is a fraction of that. CBRE found that office occupancy allocations have risen roughly 20% since 2020 and have stabilized between about 51% and 60% of pre-pandemic levels, yet actual space utilization remains under 40% [1]. That gap is the whole story: most square footage sits idle, quietly draining budget, even where occupancy looks reasonable.
Utilization rate rarely stands alone, it's built from supporting office utilization metrics that explain why the number looks the way it does. Mobility ratio shows how much of the workforce moves between spaces rather than anchoring to one desk, revealing how much flexible capacity a company actually needs [2]. Desk ratio compares the number of desks to headcount, flagging over- or under-provisioning. Capacity and peak occupancy metrics cap the picture by showing the ceiling a space can physically support [5]. Together, these feed a single utilization figure that's far more trustworthy than occupancy counts alone.
Picture a floor that shows 85% occupancy at 10 a.m., badges swiped, desks claimed, and drops to near zero by 3 p.m. as people leave for meetings, head home, or never return after lunch. A lease decision based on the morning snapshot would assume the floor is essential; the utilization pattern across the full day tells a very different story, and it's the one that should drive whether that square footage gets renewed, shrunk, or cut. This is precisely the gap Upflex's attendance forecasting and desk booking data is built to close, giving real estate leaders the full-day pattern instead of a single freeze-frame.
The office space utilization rate formula is simple: divide the hours or seats actually used by the total hours or seats available, then multiply by 100 to get a percentage. If a floor has 200 desks available for 10 working hours a day and sensors record 600 desk-hours of actual use, utilization for that day is 30%. The math is easy; the data collection behind it is where most companies struggle.
Each data source answers a different question, and mixing them up produces misleading numbers. Occupancy sensors (infrared, weight-based, or camera counts) record actual physical presence and are the closest thing to ground truth. Booking system data, desk reservations, room calendar entries, tells you intent, not attendance, which is why reservation rates and real utilization often diverge sharply. Manual tracking (walkarounds, spot checks) is the cheapest option but only captures a snapshot, not a pattern.
Upflex addresses this gap by pairing booking workflows with attendance forecasting through its UnifyAI engine, which predicts office attendance with 97% accuracy rather than relying on reservation counts alone. That distinction matters for any corporate real estate team deciding whether to trust booking data as a proxy for real usage.
A single building-wide percentage hides exactly where the waste is concentrated. A floor might show 55% overall utilization while desks sit at 35%, meeting rooms run at 70%, and open collaboration areas barely register any use at all. Blending these into one number tells a facilities director nothing actionable, it can't tell you whether to cut assigned desks, add more huddle rooms, or redesign the open lounge nobody uses.
Breaking utilization out by space type is one of several office utilization metrics worth tracking separately, alongside measures like peak occupancy and room turnover rate [2]. Signin Solutions frames this as the difference between "total workspace utilization" and "space-specific utilization", the big-picture number versus the pinpointed one that actually drives decisions [2].
The time window you choose changes what the number means. A daily average smooths out the Tuesday-Thursday crunch that defines most hybrid schedules, while a peak-day measurement shows whether you have enough desks for the busiest day of the week, the number that actually determines if you need more space, not less [3]. Weekly and long-term trend data reveal whether utilization is stable, seasonal, or declining as hybrid policies shift [3].
The most frequent error is counting a booked room as a utilized one. A meeting room reserved on the calendar but never entered still shows as "used" in booking-system reports, inflating utilization well above what sensors would record. Averaging across space types, ignoring peak demand, and relying solely on badge-swipe data, which measures building entry, not desk or room use, are the other mistakes that quietly corrupt an office space utilization rate calculation. For more information, see Service As Software Back Office.

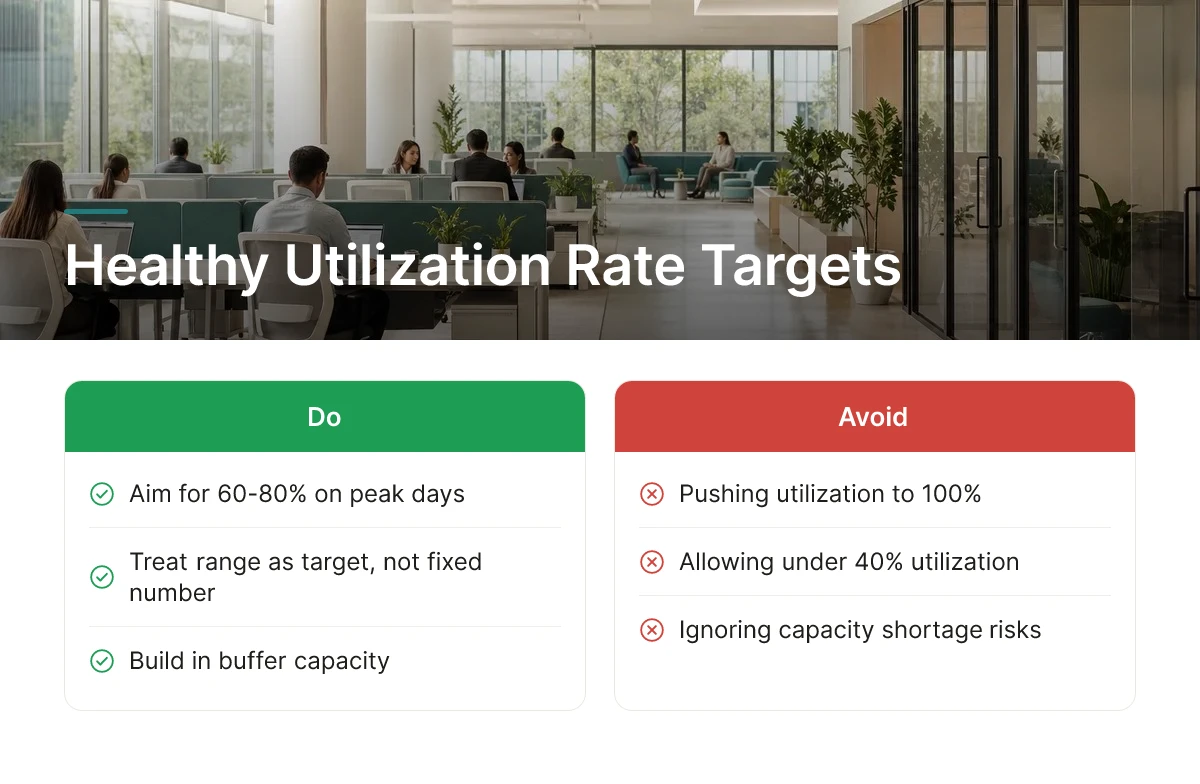
A healthy office space utilization rate sits in a range, roughly 60-80% on peak days, not at a single fixed number, and 100% is a warning sign, not a win.
If every desk is full every day, you don't have an efficient office, you have a capacity shortage waiting to happen. The moment attendance spikes even slightly above normal, employees can't find a seat, booking systems break down, and the in-office experience that leadership is trying to protect falls apart. Space utilization under 40% is a well-documented problem of waste [1], but space utilization pinned at 100% is just waste of a different kind: it means you have no buffer for the Tuesdays and Wednesdays when everyone shows up at once.
Hybrid attendance doesn't spread evenly across the week. Teams converge on anchor days, often Tuesday through Thursday, because that's when managers schedule collaboration, client meetings, and in-person work. That creates sharp peaks on those days and deep troughs on Mondays and Fridays. Any benchmark that averages attendance across five days and ignores this pattern will understate real crowding and overstate how much space a company can safely cut.
Mandates requiring three or four office days a week are pushing average attendance targets higher across most enterprises, even as actual space utilization lags behind occupancy allocations [1]. But mandates don't make attendance even, they make the peaks worse. A company that mandates Tuesday through Thursday attendance without coordinating which teams come in which days will see those three days run near capacity while the rest of the week sits mostly empty. Flexible, team-coordinated scheduling smooths this out, but only when leaders can actually see and plan around attendance patterns rather than guessing.
There's no universal target because workforce composition changes what "healthy" looks like. A sales-heavy organization with employees frequently traveling or meeting clients off-site will run a lower, more volatile office space utilization rate than an engineering-heavy company where in-person collaboration on shared systems is the norm. Company size matters too, a 500-person single-office company can coordinate attendance more tightly than a 10,000-person enterprise spread across a dozen locations with varying local norms. The right move is setting a benchmark against your own historical data and workforce mix, not importing a number from a different industry.
Raising a low office space utilization rate takes three moves in sequence: audit actual usage, cut or repurpose the space that consistently sits empty, then change how people book the space that's left.
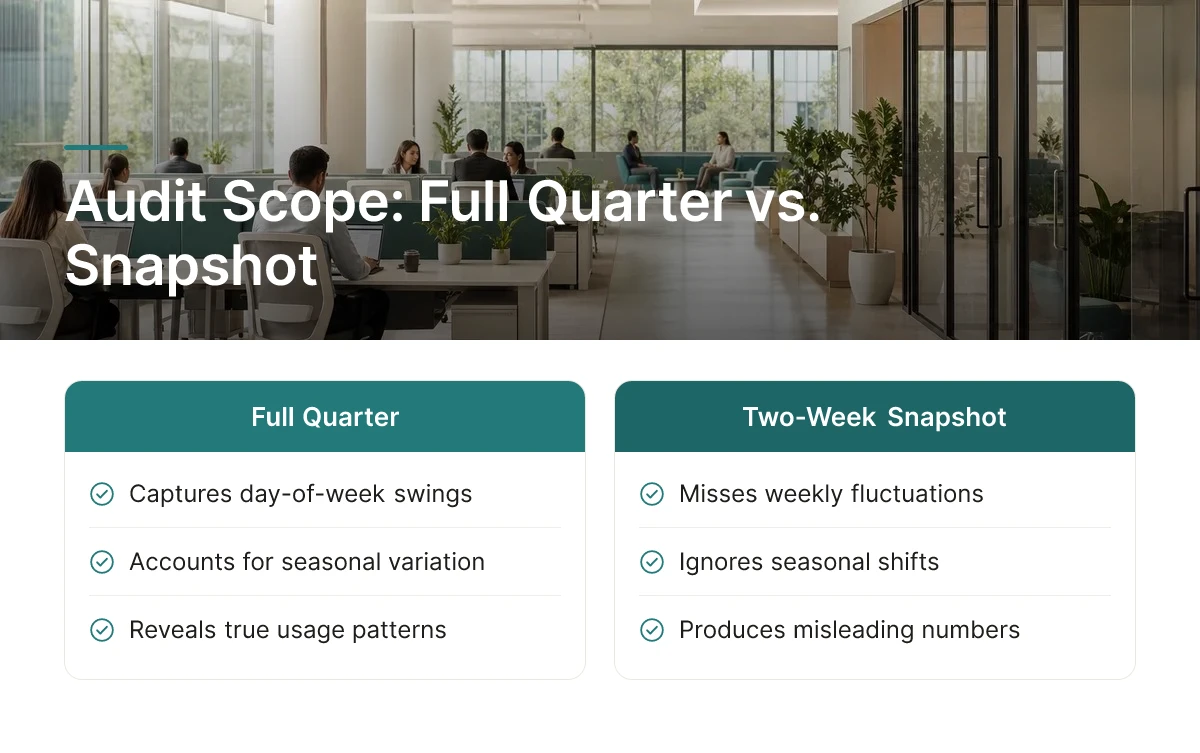
Start with the audit. Pull badge swipes, Wi-Fi connections, or sensor data across a full quarter, not a single week, utilization swings by day of the week and by season, so a two-week snapshot will mislead you [3]. Break the data down by floor and zone, not just building-wide averages, since one underused wing can hide inside a healthy-looking campus number.
Once you know which floors or zones run consistently below capacity, consolidate. Move teams off the weakest floor, sublease it or hand it back at lease renewal, and stop paying overhead on square footage nobody uses. This is the step that converts a utilization problem into a real estate decision, and it's where Upflex's real estate portfolio optimization tools are built to help, giving corporate real estate leaders the usage data needed to justify consolidation to finance, with outcomes of 40%+ reduction in real estate spend documented among organizations that have made the shift.
Next, change the booking model. Assigned desks guarantee a seat sits empty every day its owner is out, switching to shared or hot-desking lets the same desk serve two or three employees across the week instead of one, which is the single fastest lever for moving utilization up without cutting square footage first. Pair that with anchor scheduling: aligning each team's in-office days so Tuesday and Thursday draw the whole group in concentrates attendance into fewer, fuller days, rather than spreading thin attendance across all five. Upflex's UnifyAI engine forecasts attendance at 97% accuracy specifically to support this kind of coordination, helping teams hit co-attendance targets, a benchmark of 88% co-attendance achievement is realistic once scheduling aligns.
The cost mechanism is direct: higher utilization per square foot means you need fewer leased square feet to support the same headcount, which lowers both total rent and the per-head overhead finance tracks at renewal time. Validating that the change actually worked means repeating the same audit after the move, tracking utilization before and after a space reduction or scheduling change over a full quarter, not a few weeks, confirms whether the gain holds once the novelty wears off. Companies that skip this step risk resizing based on a short-term spike and finding themselves cramped again by the next lease cycle.
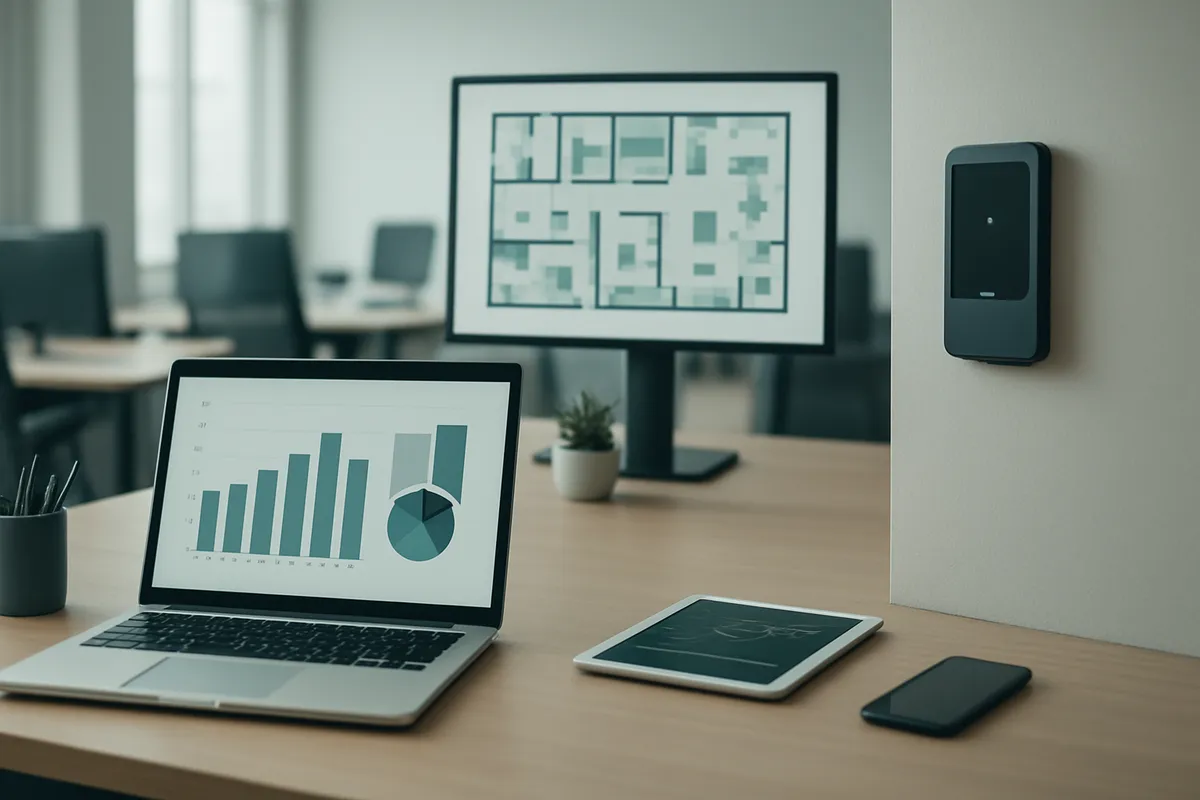
Three measurement categories dominate the market, sensors, booking software, and badge or Wi-Fi data, and AI forecasting layers on top to predict attendance rather than just report it.
Sensor-based systems (infrared, thermal, or weight-based desk sensors) give the most granular, real-time read on whether a seat is physically occupied, independent of whether anyone booked it. They're accurate but require hardware installation and maintenance across every floor you want to measure. Booking and reservation software is cheaper to deploy and captures intent, who reserved what, but it only reflects actual use if paired with check-in data, since no-shows inflate the numbers. Badge access and Wi-Fi logs are the lowest-effort option, often already collected for security purposes, but they measure building entry or network connection, not desk-level use, so they're a rougher proxy for true office space utilization rate [5].
Sensors and badge data tell you what already happened; AI forecasting platforms tell you what's likely to happen next, which is the difference between reporting and planning. A static sensor network can confirm that Tuesday hit 70% desk occupancy last week. An AI-driven platform looks at scheduling inputs, historical attendance, and team patterns to forecast which days next month will spike and which will lag, information facilities teams need before they commit to a lease decision, not after. Upflex's UnifyAI engine, for example, processes scheduling and workplace data to forecast attendance at 97% accuracy, giving real estate and HR leaders a shared, forward-looking number instead of a rearview snapshot.
An on-demand workspace network lets a company shrink its owned footprint to match average demand while still covering the occasional peak day without signing a bigger lease. Instead of sizing a headquarters for the busiest Tuesday of the quarter, a company can right-size for typical attendance and route overflow to flexible third-party locations when teams cluster for events or all-hands weeks. Upflex pairs this network with its forecasting and desk booking tools, which is one reason organizations using the combined approach have reported real estate spend reductions above 40%.
Tool choice should scale with portfolio complexity, not run ahead of it. A small team with one floor can track utilization manually with spreadsheets and spot checks, a budget-friendly starting point. A single building with moderate headcount usually justifies mid-range booking software with check-in verification. Multi-site enterprises juggling thousands of employees and several leases need an enterprise-grade AI platform that unifies forecasting, booking, and network access into one view, since spreadsheets and disconnected point tools break down at that scale.
Occupancy counts how many people are physically present at a given moment; utilization measures how efficiently that space gets used over time [1]. A conference room can show 100% occupancy during a meeting but near-zero utilization across the week. Tracking both matters: occupancy tells you who's in the building right now, while utilization reveals whether your square footage earns its cost.
Capacity, occupancy level, peak occupancy, and the core utilization rate form the baseline set facility managers rely on [5]. Beyond those, mobility ratio and cost per seat help connect space decisions to budget impact [2]. Layering in weekly patterns and long-term trends, not just a single snapshot, gives a fuller picture of how a floor actually performs across a typical month [3].
Continuously, with monthly or quarterly reviews for decision-making purposes. Utilization fluctuates by day of week and season, so a one-time count misses the pattern entirely [3]. Sensor-based or badge-based tracking that runs year-round gives Corporate Real Estate leaders the trend data needed to size renewals and consolidations with confidence, rather than guessing from a single sample week.
Yes, utilization above roughly 80-85% on a sustained basis usually signals overcrowding, not efficiency. Employees struggle to find desks or meeting rooms, which undermines the in-office experience HR leaders are trying to protect. The goal is a healthy range that balances cost efficiency with enough slack for peak days.
No, desks, meeting rooms, and collaboration zones carry different realistic targets because people use them differently [4]. A desk sitting empty for an hour isn't the same problem as a meeting room booked but unused. Benchmarks should be set per space type, not as one blanket number across the whole floor [4].
Office space utilization rate only becomes useful once you separate it from occupancy, measure it by space type, and track it continuously rather than in one-off snapshots. Most enterprises still carry utilization under 40% [1] while paying full freight on the real estate, the gap between what you lease and what gets used is where the savings live. Start by pulling four weeks of occupancy data from your existing badge or sensor system, segment it by desk versus meeting room versus collaboration space, and compare it against your lease renewal timeline. If the numbers show sustained underuse, that's your opening to right-size the portfolio before the next renewal deadline, not after.
Explore more from our content library: