Share This Article
No items found.

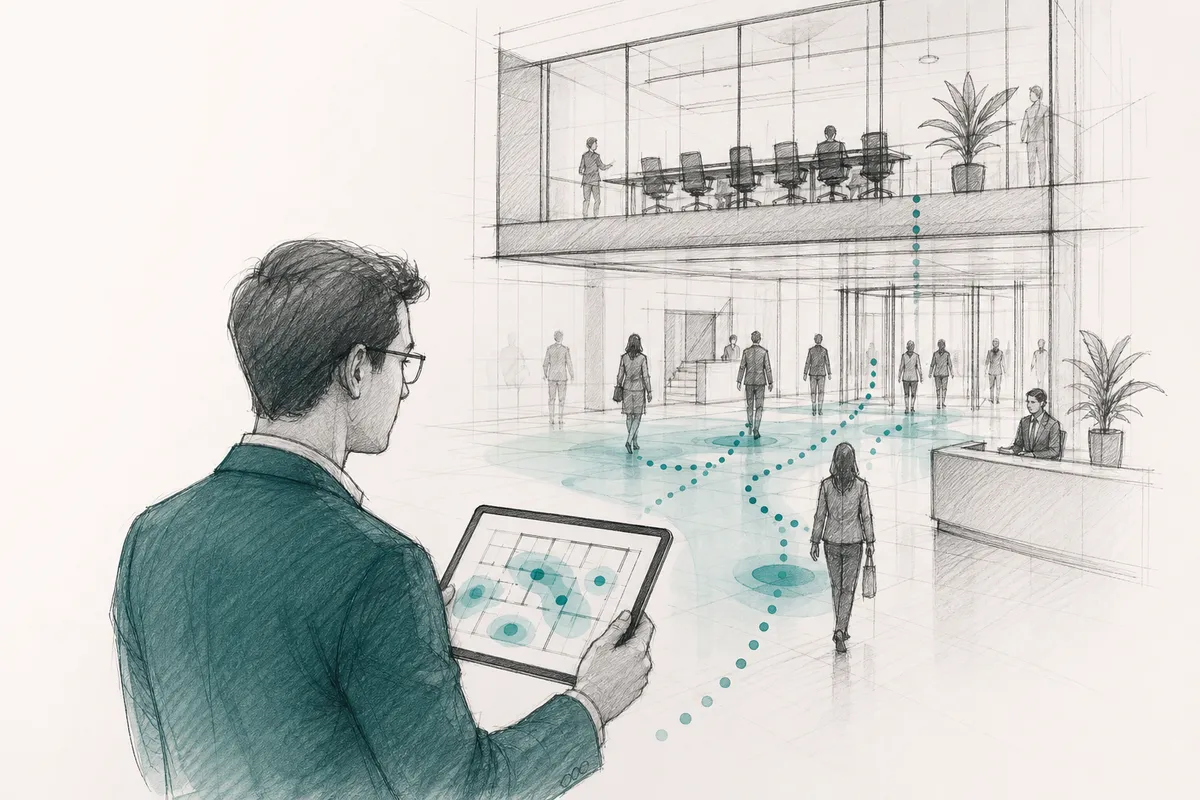
Workplace footfall analytics is the systematic measurement and analysis of how many people move through, occupy, and use spaces inside a corporate office, and when. Unlike retail foot-traffic counting, which optimizes revenue per visitor, workplace footfall analytics drives decisions about real estate sizing, desk allocation, energy use, and hybrid work policy. The output is occupancy intelligence: data that tells facilities and real estate leaders which spaces are underused, which are overcrowded, and where consolidation or investment is warranted.
Workplace footfall analytics measures people movement and space occupancy inside a corporate office to drive real estate and operational decisions, not revenue outcomes.
In a corporate setting, footfall data tracks how many people enter a building, move through floors, occupy zones, and use individual rooms, and at what times. The downstream decisions this data serves are about cost and efficiency: whether to consolidate floors, right-size a lease, or adjust desk ratios.
The analytics pipeline runs from raw sensor signals to structured occupancy metrics. Sensors capture entry events and presence data, which are then aggregated, cleaned, and normalized into measures like peak headcount, dwell time, and utilization rate. Those metrics feed dashboards and planning tools that real estate and facilities teams use to make space decisions.
Granularity level determines which questions you can actually answer. Building-entry counts tell you whether a location is broadly underused. Floor and zone data reveal which neighborhoods attract teams and which sit empty. Room-level data, from meeting room sensors, for example, shows whether booked space is actually occupied. Each layer down enables a more specific decision, from portfolio consolidation to individual desk allocation.
Retail footfall tracking [1] focuses on revenue growth: visitor counts feed conversion rate analysis, merchandising decisions, and POS system integrations. Workplace footfall analytics targets cost reduction, specifically, identifying underused square footage and aligning space supply with actual demand.
The audience is also different. Employees carry privacy rights that anonymous shoppers do not, so corporate deployments require consent frameworks, data minimization, and compliance with regulations like GDPR. Retail systems largely skip that layer.
Integration targets diverge too. Workplace footfall data connects to desk booking platforms, building management systems, and hybrid scheduling tools, the operational layer that governs how employees experience the office. Retail footfall data connects to POS terminals and merchandising software, where the goal is spend per visitor. For a broader grounding in how footfall is defined and measured across contexts, FootfallCam's definition of footfall [2] provides a useful reference point.
Workplace footfall analytics relies on four core metrics, utilization rate, peak occupancy, dwell time, and flow rate, each answering a different operational question.
Utilization rate divides occupied seats by available seats across a defined time window, typically a week or month. It tells you what share of your real estate is actually in use, not just booked.
Peak occupancy captures the highest simultaneous headcount recorded in a period. This number drives decisions about maximum capacity and emergency egress planning, not day-to-day space allocation.
Dwell time measures how long people actually occupy a space. A desk used for 20 minutes before someone moves to a meeting room contributes very differently to utilization than one occupied for six hours.
Flow rate counts entries and exits per hour at a zone boundary, a floor, a wing, or a building entrance. It reveals congestion patterns and informs staffing decisions at reception or amenity areas [3].
Desk booking data adds a fifth signal: the gap between booked and physically occupied desks. When employees book and don't show, that delta exposes the difference between planned and actual attendance, a critical input for hybrid work policy calibration. Platforms like Upflex surface this gap directly, using attendance forecast data alongside booking records to show where planned presence consistently fails to materialize.
A reliable baseline requires a minimum observation window of several weeks, short samples distort easily. A single week that includes a public holiday or a company all-hands will skew averages significantly.
Seasonal variation and hybrid schedule patterns compound this problem. Summer attendance typically drops; Q4 budget cycles pull people into more frequent in-person meetings. A baseline built on six to eight weeks of normal operations across a representative season gives you a stable reference point.
Baselines also need recalibration after any policy change. A new return-to-office mandate, a lease consolidation, or a shift in team structure all alter attendance patterns enough to make prior benchmarks misleading.
Distinguish between instantaneous occupancy, a snapshot of who is in the building right now, and time-averaged utilization, which smooths counts across hours or days into a trend. Real-time snapshots drive HVAC and lighting controls; trend data drives space consolidation decisions. Using a snapshot to justify a lease exit, or a monthly average to control building systems, produces the wrong answer in both cases.
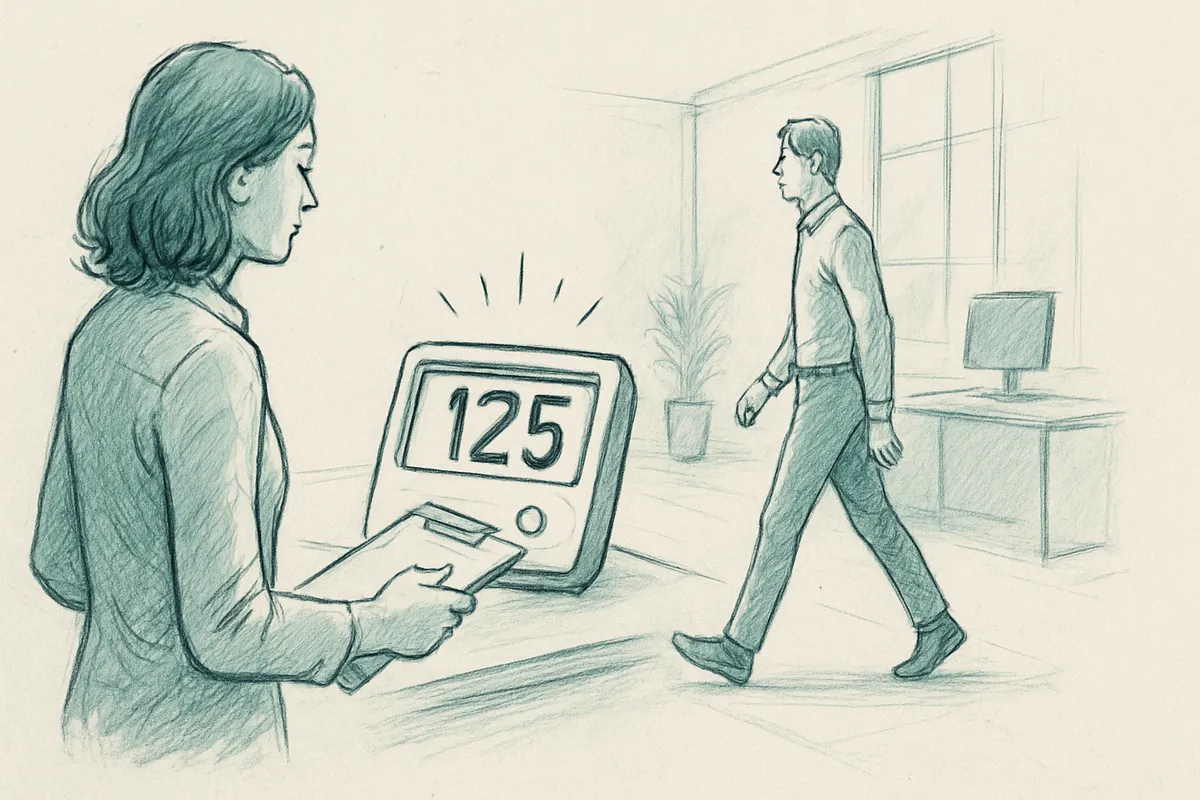
Four main sensor technologies power workplace footfall analytics: computer vision, thermal/infrared, WiFi/Bluetooth, and sensor fusion, each with distinct accuracy, privacy, and cost trade-offs.
Computer vision uses overhead cameras paired with anonymization processing, silhouette detection, not facial recognition, to deliver zone-level granularity across open floors and meeting rooms. The spatial accuracy is high, and the system can distinguish between someone walking through a space and someone occupying it. The trade-off: camera networks require meaningful IT infrastructure, and computer vision attracts the highest level of employee privacy scrutiny of any sensor type.
Thermal and infrared sensors detect heat signatures rather than images, which means they capture no identifiable data at all, making them the lowest-privacy-risk hardware option available. That advantage narrows in dense open-plan environments, where overlapping heat signatures reduce counting precision and zone attribution becomes unreliable.
WiFi and Bluetooth-based tracking works by detecting device presence through network probes or BLE beacons, giving building-wide coverage at a lower hardware cost than camera or thermal systems. The accuracy ceiling is lower, though: the method counts devices, not people. An employee who leaves a laptop at their desk while attending a meeting elsewhere registers as present in the wrong zone, a systematic blind spot that compounds in hybrid offices.
Sensor fusion combines two or more signal types, for example, thermal sensors for zone-level headcount paired with desk-level contact sensors for individual seat state, to correct the blind spots each method carries alone. The result is higher-confidence occupancy data, but at a premium-tier investment in both hardware and integration.
The right choice depends on four variables: office layout, required granularity, privacy constraints, and budget.
Workplace footfall analytics turns raw occupancy counts into decisions that cut costs, reduce wasted energy, and make hybrid policies defensible with data.
The clearest financial lever is real estate right-sizing. When footfall data shows that a floor consistently peaks at 30% occupancy across a rolling quarter, that pattern becomes the evidence base for a lease consolidation conversation, not a gut feeling. The decision chain runs from sensor data to utilization reports, through corporate real estate to the CFO, and then to a property action: subletting, exiting, or renegotiating a lease at renewal.
Energy efficiency follows the same logic. Real-time occupancy feeds directly into building management system triggers, when sensors detect an empty zone, HVAC and lighting controls scale back automatically. The feedback loop is continuous: occupancy drops, the BMS responds within minutes, and conditioning of empty space stops. Over a full year, that compounding effect across multiple floors reduces energy spend materially.
Hybrid policy calibration is a third lever that HR and real estate leaders often underuse. Footfall trend data shows which days see genuine in-office demand and which are structurally underattended regardless of policy. That distinction lets leaders set anchor days or adjust desk-to-headcount ratios based on observed behavior rather than assumption.
The ROI mechanism is not a single metric. Cost savings compound across reduced lease liability, lower energy spend, and deferred capital expenditure on space build-out, each reinforcing the others when occupancy data is applied consistently.
Pairing footfall counts with desk booking data closes the "ghost booking" problem, spaces reserved but never physically occupied. When a booking system shows a desk claimed but the sensor records zero presence, that combined signal flags the gap. Over time, those flags improve forecast accuracy by removing phantom demand from future space planning models.
Platforms like Upflex connect booking behavior with real attendance data through its UnifyAI engine, which forecasts office attendance with 97% accuracy. That forecast feeds back into space allocation decisions, so the building management system and the booking layer operate from the same picture of actual demand rather than two disconnected data streams. Organizations looking to extend footfall insights into customer-facing service environments can also draw on guidance such as Qminder's overview of footfall analytics for customer service [4], which illustrates how the same underlying data principles apply across different operational contexts.
Employee movement data carries a higher legal burden than retail visitor counting because employees hold contractual and statutory rights that anonymous shoppers do not.
Under GDPR, footfall data becomes personal data the moment it can be linked, even indirectly, to an identifiable individual. That threshold is easier to cross than most teams expect: a sensor log showing one person entered a meeting room at 9:04 a.m. on a day only one employee was scheduled can constitute personal data without ever recording a name.
Four GDPR principles apply directly to any workplace footfall analytics program. First, lawful basis: legitimate interest is the most common basis organizations rely on, but it requires a documented balancing test showing that occupancy planning outweighs individual privacy impact. Consent is rarely appropriate in an employment context because the power imbalance makes it difficult to demonstrate that consent is freely given. Second, data minimization: collect only what the occupancy use case requires, aggregate counts, not individual traces. Third, purpose limitation: data collected for space planning must not migrate into performance monitoring or attendance enforcement. Fourth, storage limitation: retention periods must be defined before deployment and enforced automatically, not left as a policy aspiration.
The clearest technical safeguard is anonymization at the point of capture. Sensors should output aggregate counts, not individual movement paths. Facial recognition has no place in occupancy monitoring, and footfall data must not be cross-referenced with HR identity systems. Where group sizes fall below a defined threshold, commonly five or fewer people, data should be suppressed to prevent inference about specific individuals.
The distinction between occupancy analytics (space-level, aggregate) and individual location tracking (person-level) is both an ethical and a legal boundary. Keeping your program firmly in the former category is the design choice that holds up to regulatory scrutiny.
Transparency is not optional. Employees must be informed, through a privacy notice, what monitoring is in place, what data is collected, how long it is retained, and who can access it. In jurisdictions where works councils or employee representative bodies exist, consultation before deployment is a legal requirement, not a courtesy. Platforms that support occupancy planning through aggregated, anonymized data, rather than individual-level tracking, make this compliance posture significantly easier to maintain and demonstrate.
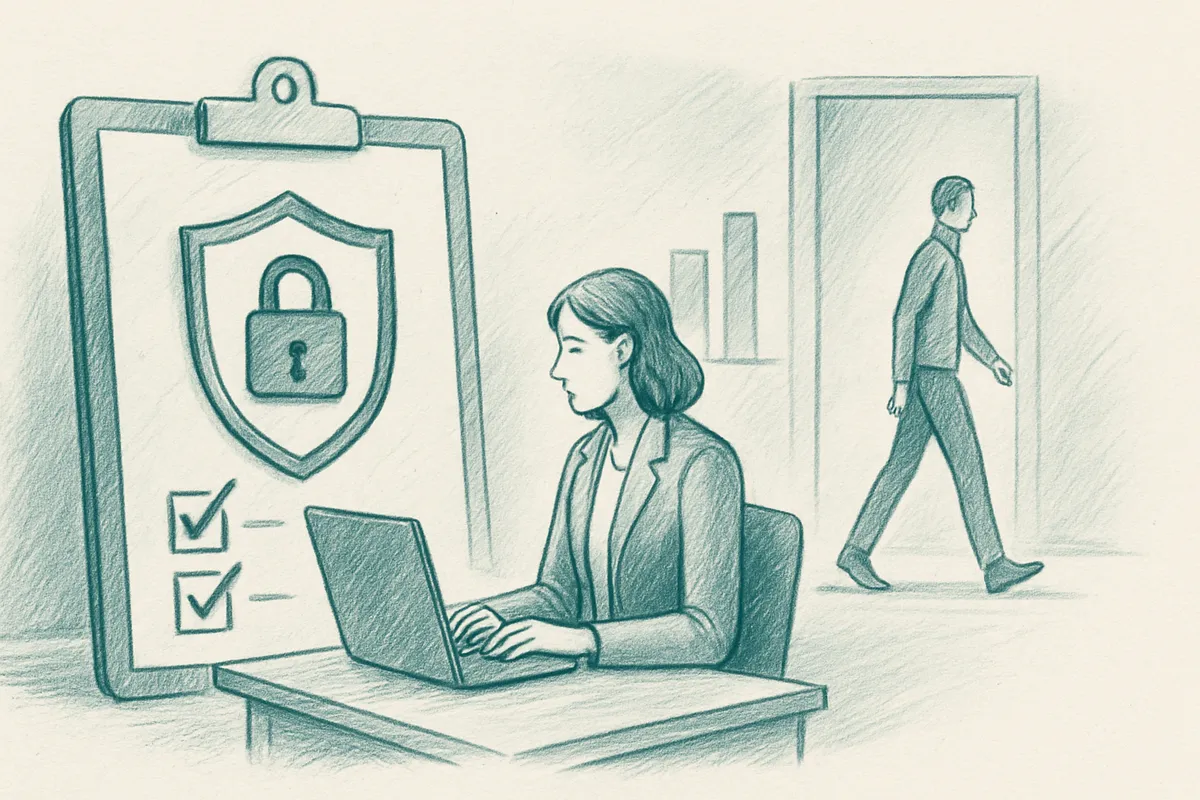
Occupancy rate measures how many desks or rooms are booked; utilization rate measures how many are actually in active use during a given period. A desk can be booked but sit empty for hours, that gap is where most organizations discover their real space waste. Footfall analytics captures actual presence, giving you utilization data rather than just reservation data, which produces a more accurate picture of how your office is genuinely being used day to day.
Yes, variable attendance is exactly the condition footfall analytics is designed to handle. Systems that combine sensor data with AI-driven forecasting, such as Upflex's UnifyAI engine, predict attendance patterns even when daily headcounts fluctuate significantly. That 97% forecast accuracy means space planners can make confident decisions about desk allocation and floor activation without waiting for attendance to stabilize into a predictable routine.
Most organizations see initial trend data within two to four weeks of deployment, once sensors are calibrated and baseline traffic patterns are established. Meaningful pattern recognition, peak-day clustering, underused zones, team co-attendance rates, typically emerges after four to eight weeks of continuous data collection. The more historical data the system accumulates, the sharper its forecasts become, so insight quality improves progressively over the first quarter.
Not always, it depends on the sensor technology your organization deploys. Overhead infrared and video-based people counters detect presence anonymously without any employee action or device [2]. Badge-based and Wi-Fi systems do require employees to carry a credential or connected device, but they return richer identity-linked data. Many organizations combine both: anonymous sensors for aggregate counts and badge or app check-ins for team-level coordination and desk booking workflows.
Start by mapping your primary use case: portfolio-level lease decisions require different data granularity than day-to-day desk allocation or energy management. Evaluate platforms on their sensor compatibility, integration depth with your existing desk booking and building management systems, and their approach to data anonymization. Organizations operating under GDPR or similar regulations should also assess whether the platform supports aggregate-only reporting and configurable retention periods before committing to a deployment.
Workplace footfall analytics closes the gap between the office you're paying for and the office your teams actually use. Three things are worth acting on now: first, audit which sensor inputs you already have, badge readers, Wi-Fi access points, or cameras, because you may be sitting on raw data that isn't yet feeding any planning decision. Second, separate your occupancy numbers from your utilization numbers; they tell different stories, and conflating them leads to bad portfolio calls. Third, connect footfall data to attendance forecasting so space decisions are forward-looking, not just historical.
A practical next step: pull your last 90 days of desk booking data alongside any badge entry records and map the gap between booked desks and confirmed arrivals. That single comparison will show you exactly where to start.
Explore more from our content library: