Share This Article
No items found.


The most useful corporate real estate benchmarking metrics fall into three buckets: cost efficiency (cost per square foot, cost per employee), space performance (occupancy rate, utilization rate), and experience (workplace satisfaction scores, tenant experience indices). Tracking these together, rather than cost alone, shows whether a hybrid portfolio is actually working, because a cheaper footprint that leaves employees unable to find usable space isn't a win. Pair each metric with a peer group, market index, or your own historical baseline so the numbers mean something.
Cost per square foot only becomes useful for corporate real estate benchmarking once you compare it against a peer group, market index, or your own historical trend, the raw number alone tells you nothing.
Calculate it as total rent plus operating costs divided by occupied area. On its own, a figure like $38 per square foot means little; set against a market index or a comparable office in your portfolio, it tells you immediately whether a site is overpriced, under-negotiated, or simply misclassified.
This metric is best suited to portfolio leaders managing multiple leased locations who need a fast cross-site read without waiting on a full annual review. Its main benefit is speed: it surfaces outlier locations, the one office paying 20% more than its peers for comparable space, before anyone opens a spreadsheet model.
The differentiator most dashboards miss: cost per square foot has to be read alongside occupancy rate. A location that looks cheap on a per-square-foot basis but sits half-empty is not efficient space, it is waste priced attractively. Blending the two metrics is what prevents that trap.
Space utilization rate measures how often seats and rooms are actually occupied over time, which is the number that matters most once hybrid schedules break the old link between headcount and desks.
Utilization differs from occupancy in a specific way: occupancy tracks whether a seat is assigned, while utilization tracks whether that seat is actually used on a given day. A floor can show 90% occupancy on paper and 40% utilization in practice if employees are assigned desks they rarely visit [4].
Workplace teams deciding whether to consolidate floors or redesign layouts should lead with this metric. Its benefit is concrete: it flags underused space before a lease renewal decision locks in that waste for another five or ten years.
The differentiator here is measurement method. Sensor or badge-based data captures usage continuously, across every day and every shift pattern, while manual headcounts capture a single moment that may not represent a typical week. A Tuesday headcount in a Monday-light office will always overstate utilization, continuous data does not make that mistake.
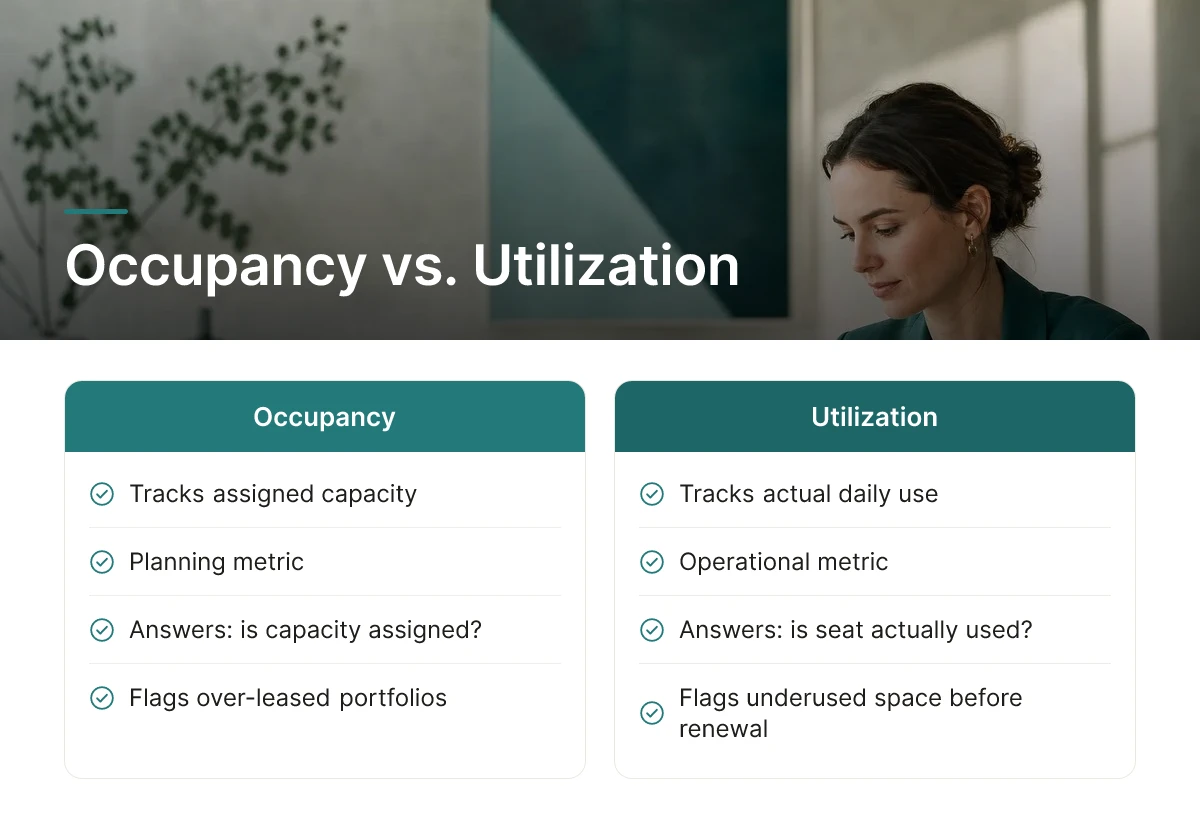

Occupancy rate measures how much of your assigned or leased capacity is actually in use against the capacity available, making it a planning metric rather than a daily-usage one.
It answers a different question than utilization: not "did someone sit here today" but "is this capacity assigned and accounted for at all." Real estate planners use it to check whether current footprint still matches where headcount is actually heading, especially ahead of a renewal decision [2].
This metric is best for planners evaluating whether a lease should shrink, hold, or expand relative to growth projections. Its benefit is early warning: it flags over-leased portfolios carrying capacity nobody needs, and under-leased ones at risk of running out of room before the next cycle.
The differentiator is that occupancy rate alone is a static snapshot. Pairing it with utilization data, what's assigned versus what's actually used, is what turns a one-time space report into an ongoing corporate real estate benchmarking practice that leadership can act on quarter after quarter.

Workplace satisfaction score quantifies how employees feel about office space through pulse surveys and post-visit feedback, turned into a trackable number you can chart against cost and space metrics.
Instead of running a yearly engagement survey in isolation, leading teams collect short pulse surveys after in-office days or post-visit feedback tied to specific locations, then aggregate scores into an index that sits on the same dashboard as occupancy and cost per square foot [1]. This is where benchmarking stops being a real estate-only exercise.
Satisfaction scores are the leading indicator that cost metrics miss entirely, a cheap, consolidated office that employees dislike shows up in attrition and disengagement long before it shows up in a real estate report. HR and workplace experience teams reporting alongside real estate on hybrid strategy performance need this number to make that case.
The benefit: it connects cost decisions to retention and productivity risk before those risks appear in attrition data. The differentiator competitors tend to leave vague is the actual mechanism, low satisfaction scores translate into hidden costs through three specific channels: higher voluntary attrition, reduced in-office collaboration as employees self-select out of the office, and disengagement that shows up in productivity metrics months later.

Cost per employee divides total occupancy cost by headcount, correcting the distortion that cost per square foot creates when work styles differ sharply across sites.
Two offices can carry identical cost per square foot while one runs dense desk-sharing and the other keeps mostly assigned seating, total occupancy cost per employee exposes that gap in a way a square-footage number cannot [5]. It's a more honest cross-office comparison once hybrid ratios vary by location.
Finance and corporate real estate leaders building the business case for portfolio consolidation should treat this as a primary input. The benefit is directness: it converts hybrid policy changes, fewer assigned desks, more shared and on-demand space, into a dollar figure per head that a CFO can act on immediately.
The differentiator is splitting the number into fixed costs (base rent, long-term lease obligations) versus variable costs (utilities, services, on-demand workspace access). Hybrid policy can meaningfully influence the variable portion fast; fixed costs only move at lease renewal. Platforms like Upflex make this split visible by pairing attendance forecasting with on-demand workspace usage data, showing finance teams exactly which part of occupancy cost per employee shifts with policy and which part is locked in until the next negotiation.
The flexibility ratio measures what share of your portfolio sits in short-term, flexible, or on-demand arrangements versus traditional long-term leases. It's the clearest forward-looking signal in corporate real estate benchmarking because it tells you how fast you can respond when headcount or hybrid adoption shifts, not just how much you're spending today.
This metric matters most to real estate strategy teams planning around uncertain growth curves, a company adding 500 people next year under one scenario and losing 200 under another needs a portfolio that can flex both directions. Benchmarking the ratio against peers shows whether your footprint can absorb demand shifts without financial penalty, while a portfolio locked into 10-year terms cannot.
The mechanism matters here: every square foot under a rigid long-term lease is a bet that today's headcount and attendance pattern holds for years. When that bet fails, you're left paying for stranded space you can't exit or sublease quickly. A higher flexibility ratio, achieved by blending owned space with on-demand workspace access, caps that downside, converting a fixed liability into a variable cost that tracks actual usage.
Carbon footprint per square foot or per employee measures energy consumption against space data, and it now sits on the same dashboard as cost and utilization metrics rather than in a separate ESG report.
Sustainability officers and corporate real estate leaders facing reporting mandates or investor scrutiny need this number tied directly to portfolio decisions, not isolated in an annual disclosure. Proprli notes that as corporate real estate shifts from pure cost management toward broader performance measurement, metrics increasingly need to account for building demands alongside complexity in property and facility management [2].
Calculate energy use intensity per square foot from utility billing and metering data, then normalize it per employee using occupancy figures. Track the trend quarter over quarter and compare it against similar building types and climate zones rather than a single universal threshold.
Benchmarking sustainability alongside cost prevents a common blind spot: an efficiency gain that looks good on one ledger but simply shifts environmental cost elsewhere, like consolidating into a building with worse HVAC efficiency per occupant. The mechanism worth understanding is that consolidating into fewer, better-utilized locations typically lowers energy intensity per employee, shared systems, elevators, and lighting serve more people per square foot. That links sustainability performance back to utilization rate rather than treating it as a standalone initiative.
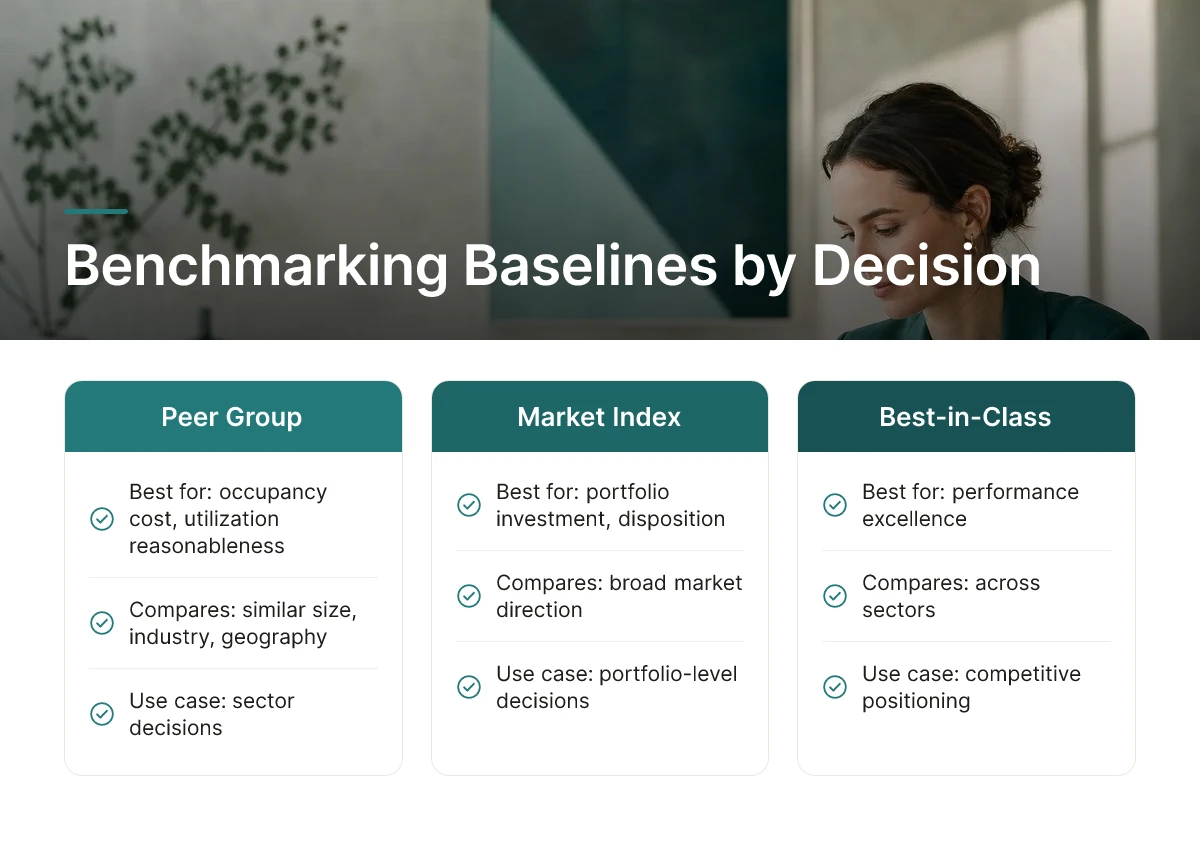
Pick metrics based on your strategic question, then match the comparison baseline, peer group, market index, or internal history, to the decision you're actually trying to make.
Peer group benchmarking compares you against organizations of similar size, industry, and geography, and works best when you're deciding whether your occupancy cost or utilization rate is reasonable for your sector. Market index benchmarking, using sources like the FTSE NAREIT Index [3], shows broad market direction and suits portfolio-level investment or disposition decisions. Best-in-class benchmarking ignores sector and compares you to top performers anywhere, which is useful when the goal is aggressive transformation rather than parity with peers.
A 200-person single-office company gets more value from internal historical tracking, month-over-month utilization trend, than from chasing an industry index that reflects portfolios ten times its size. A multi-site enterprise needs peer group and market benchmarks layered together, since individual sites vary enough that only cross-location comparison surfaces underperformers.
Benchmark against your own historical performance when the goal is tracking the pace of improvement, since trend direction matters more than absolute position early in a hybrid transition. Switch to competitor or industry comparison once you need to justify a decision, a lease renewal, a consolidation, a board presentation, where "better than before" isn't a sufficient answer.
Start with five steps: define the business objective, pick three to five core metrics, select a baseline, set a quarterly review cadence, and assign ownership to one accountable leader. Platforms that combine attendance forecasting with workplace orchestration, Upflex among them, through its UnifyAI engine's 97% forecast accuracy and automated space data collection, remove the manual work of standardizing utilization figures across dozens of locations, which is often the real barrier to consistent benchmarking.
Benchmarking shows whether your occupancy cost per employee and utilization rate are in line with peers, so you know where to cut without guessing. Without it, teams either keep paying for empty floors or cut too aggressively and lose space employees actually need. Platforms like Upflex pair utilization data with attendance forecasting to show which offices are candidates for consolidation and which need to stay.
It starts with pulling consistent data, badge swipes, booking records, lease costs, across every site, then normalizing it so a 50-person office in one city compares fairly to a 500-person office in another. Next, plot your metrics against industry or internal targets to spot outliers. Finally, route findings to real estate, finance, and HR leaders together, since space decisions affect budget and employee experience at once [2].
Volatile periods make static benchmarks unreliable, since interest rates, leasing demand, and attendance patterns can shift within a single quarter [3]. The fix is tracking rolling trends rather than one-time snapshots, comparing quarter-over-quarter utilization and cost shifts instead of a fixed annual target. This keeps decisions grounded in current conditions, not a stale baseline set before the market moved.
Standardize definitions first, "utilization rate," "occupancy cost," and "peak usage" need identical formulas everywhere before you compare a single number across sites [4]. Centralize collection through one platform rather than stitching together spreadsheets from each regional team. Audit for gaps quarterly, since missing badge data or inconsistent booking adoption will skew benchmarks more than any market factor will.
Assign each metric a specific owner and a target tied to a business outcome, like reducing occupancy cost or hitting a co-attendance goal. A gap between current and benchmark performance should trigger a defined action, consolidate a floor, renegotiate a lease, or adjust scheduling, not just a report nobody follows up on.
Corporate real estate benchmarking only works when the metrics connect to decisions, total occupancy cost and utilization rate flag where you're overpaying, co-attendance tracking shows whether hybrid policies are actually working, and consistent data definitions keep comparisons honest across sites. Treat benchmarks as a rolling process tied to quarterly reviews, not an annual report that sits in a drawer. Start by auditing whether your current utilization data is consistent enough across locations to trust a single benchmark number, if it isn't, fix that before setting any cost-reduction target.
Explore more from our content library: