Share This Article
No items found.


Real estate forecasting is the practice of using historical data, economic indicators, and statistical models to predict future property values, demand, and market conditions. It matters because decisions about leasing, buying, or consolidating real estate portfolios carry multi-year financial consequences — accurate forecasts reduce that risk. Leading AI-driven platforms now achieve up to 97% forecast accuracy, giving corporate real estate teams the confidence to cut portfolio spend by 40% or more.
Property market forecasting uses historical transaction data, macroeconomic indicators, and predictive models to estimate future property values, occupancy demand, and market direction.
The definition is straightforward. The financial consequences of getting it wrong are not. Multi-year lease commitments mean a 10–15% forecast error can cost an enterprise millions in locked-in spend on space it no longer needs. A platform achieving 97% attendance forecast accuracy, like Upflex's UnifyAI engine, gives corporate real estate leaders the data confidence to cut portfolio spend by 40% or more. That gap between a bad forecast and a precise one is measured in lease lines on a balance sheet.
"The most dangerous forecasting error isn't being wrong about price direction — it's missing a structural shift in demand that no historical pattern anticipated." — Lawrence Yun, Chief Economist at the National Association of Realtors
According to J.P. Morgan Global Research, US home prices remain elevated due to persistent supply constraints — a structural imbalance that accurate forecasting models would have flagged 12–18 months before it became headline news. Housing starts have failed to keep pace with household formation for years, and that gap does not close quickly.
This matters beyond residential markets. Elevated asset values affect cap rates, borrowing costs, and the relative economics of owning versus leasing commercial space — all inputs that investor and developer forecasting models must price in when projecting returns.
Existing home sales fell to near 30-year lows in 2023 [1], a trend driven by the "lock-in effect" — owners holding sub-3% mortgages and refusing to trade up into a 7%+ rate environment. Transaction volume collapsed even as prices held.
That combination — high prices, low velocity — illustrates why property market analysis must track multiple variables simultaneously, not just price direction. A forecast that predicted rising prices in 2022 was technically correct and operationally misleading if it missed the liquidity freeze that followed.
This dynamic also separates the two primary use cases for real estate forecasting. Investor and developer forecasting centers on asset valuation, cap rate prediction, and transaction timing. Corporate real estate forecasting focuses on space demand, headcount-to-desk ratios, and portfolio rightsizing — a fundamentally different set of inputs with equally high financial stakes.
Hybrid work has made the corporate side harder than at any point in the past 30 years. Occupancy is no longer a function of headcount. A 500-person company might fill 60% of its desks on Tuesday and 20% on Friday, and neither number is predictable without purpose-built forecasting tools. That decoupling of occupancy from headcount makes demand forecasting both more consequential and more technically demanding than it has ever been.
Regression, machine learning, and time series are the three dominant real estate forecasting methods, each with distinct accuracy profiles, data needs, and failure modes.
Regression analysis (OLS and hedonic pricing models) excels at explaining why prices move. Interpretable coefficients let analysts isolate the contribution of individual variables — square footage, school district, interest rate — making results defensible in boardrooms. Typical R² values run 0.70–0.85 in stable markets, but accuracy degrades sharply during structural breaks. The 2020–2022 pandemic distortion exposed this weakness: models trained on pre-2020 data systematically underestimated price acceleration.
Machine learning models — gradient boosting, random forests, and neural networks — outperform regression on non-linear relationships and large feature sets. Zillow's Zestimate uses an ensemble approach and reports a median error rate of roughly 2.4% nationally, though that figure climbs to 6–8% in thin markets with sparse transaction data. The trade-off is interpretability: a gradient-boosted model with 200 features doesn't produce a clean coefficient table.
Time series methods (ARIMA, SARIMA, Prophet) are purpose-built for sequential data with seasonal patterns. They perform well on short-horizon price and volume forecasts, typically 1–6 months out, but struggle with exogenous shocks like a sudden rate hike or a pandemic-driven demand surge that no historical pattern anticipates.
| Method | Accuracy Range | Data Requirements | Interpretability | Implementation Complexity |
|---|---|---|---|---|
| Regression (OLS / Hedonic) | R² 0.70–0.85 (stable markets) | Low–moderate | High | Low |
| Machine Learning (ensemble) | ~2.4% median error (deep markets); 6–8% (thin) | High | Low | High |
| Time Series (ARIMA / Prophet) | Strong at 1–6 months; degrades at 12+ | Moderate | Moderate | Moderate |
Most serious real estate forecasting operations no longer pick a single method. Firms like CoStar and CBRE now use hybrid approaches — time series models for trend and seasonality detection, layered with machine learning for feature-rich price prediction. This combination captures both the cyclical patterns a SARIMA model handles well and the complex variable interactions that a gradient-boosted tree resolves more accurately.
Building a custom model starts with clean, consistent transaction data, then adds macro inputs (interest rates, employment figures) and property-level attributes before selecting the architecture that matches your forecast horizon and interpretability requirements. For most corporate real estate teams, the practical starting point is a hedonic regression to establish baseline drivers, with ML added as data volume grows.
Key steps for building a forecasting model from scratch include:
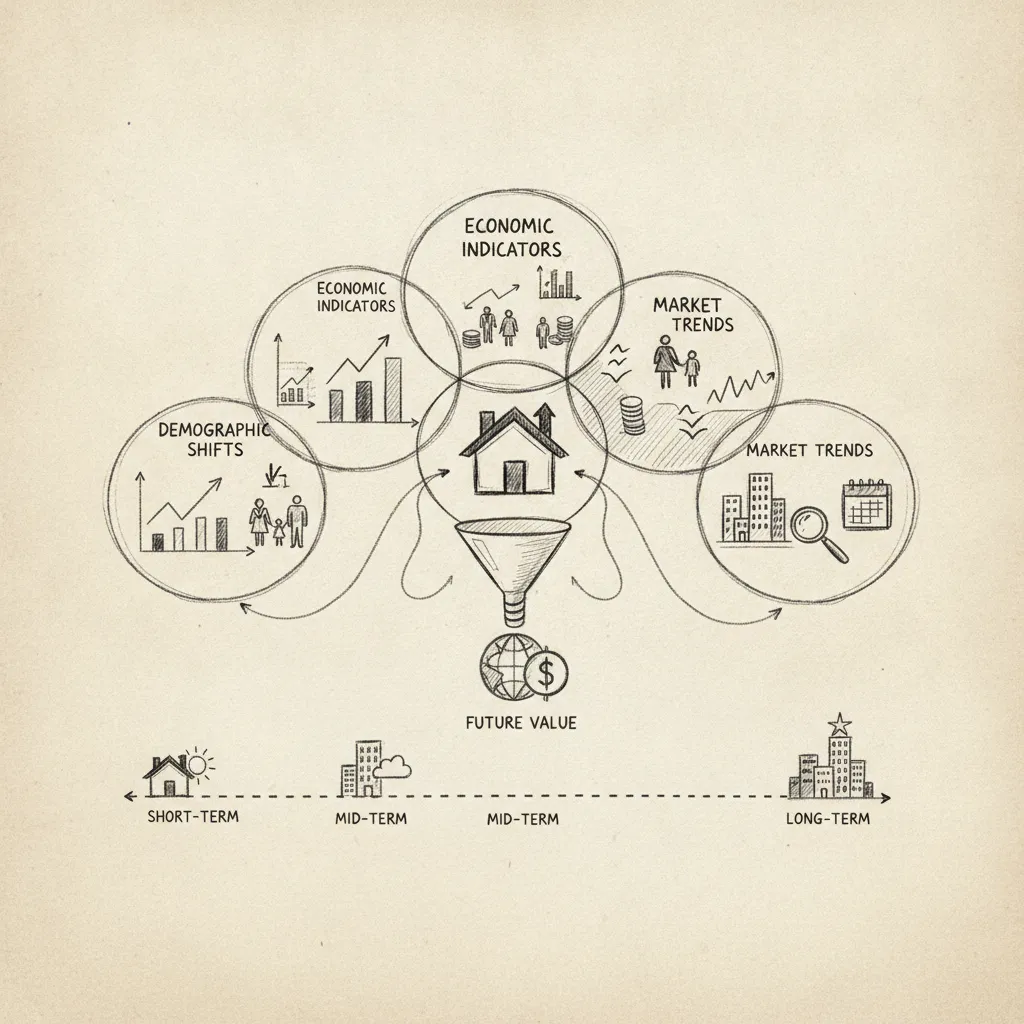
Property market analysis draws from public government datasets, commercial data APIs, and specialized software — the quality of each input determines how reliable the output is.
Public sources form the foundation of most models. The US Census Bureau's housing data, including the American Community Survey and Building Permits Survey, the Federal Housing Finance Agency's House Price Index, NAR's existing home sales data [2], and BLS employment figures are all freely accessible and updated monthly or quarterly, making them the default starting point for any analyst building a demand or pricing model.
Commercial APIs add granularity that government data cannot. The CoStar API covers commercial leasing and vacancy rates at the property level. Zillow Research Data publishes residential price indices by ZIP code. Redfin's Data Center tracks days on market and list-to-sale ratios in near real time. ATTOM Data Solutions provides deed, mortgage, and distressed property records, useful for identifying supply-side pressure before it shows up in headline statistics.
The software stack most teams run: Python libraries — scikit-learn, statsmodels, and Facebook Prophet — for custom model building; Tableau or Power BI for visualization; and enterprise platforms like Reonomy, HouseCanary, and Cherre for integrated real estate intelligence at scale.
For corporate real estate teams, the most critical inputs are internal, not public. Badge swipe data, desk utilization rates, and meeting room occupancy sensors feed demand-side forecasting in ways that NAR reports or Census figures simply cannot. Platforms like Upflex capture this workplace utilization data continuously, feeding it into attendance forecasting models — Upflex's UnifyAI engine predicts office attendance with 97% accuracy by processing exactly this type of sensor and scheduling data.
Data quality is the primary failure point across all forecasting work. Models trained on pre-2020 occupancy data systematically underestimate hybrid work's impact on space demand. Teams that have not retrained their models on post-2022 data are working with structurally biased outputs — a problem no visualization tool or API subscription can fix after the fact.
Forecast accuracy varies widely by asset class and geography — from sub-3% error at the national level to double-digit misses at the zip-code or market segment level.
Residential price models set the benchmark. Zillow's Zestimate carries a median absolute error of roughly 2.4% nationally for on-market homes, a figure Zillow publishes and updates regularly. CoreLogic's Home Price Index forecasts have historically shown mean absolute errors of 1.5–3% at the national level, but that error widens to 5–12% at the zip-code level, where thin transaction volumes and local idiosyncrasies undermine model confidence.
Commercial real estate forecasting is harder, and the 2020–2022 office market proved it. CBRE and JLL vacancy rate forecasts for office markets missed actual outcomes by 8–15 percentage points during that period — the largest documented forecast error in the modern era. The primary driver was hybrid work adoption, which neither firm's models had been trained to anticipate at scale.
"Hybrid work didn't just change where people work — it fundamentally broke the assumptions underlying every office demand model built before 2020. Forecasters who haven't rebuilt their models from the ground up are still flying blind." — Martha Peyton, Managing Director of Real Estate Strategy at Aegon Asset Management
Corporate space demand forecasting tells a different story when the input data is behavioral rather than transactional. AI-driven attendance forecasting, as deployed in Upflex's UnifyAI engine, achieves 97% accuracy for predicting who will be in the office and when. That precision lets real estate teams right-size reservable desks and reduce portfolio footprint without guessing, and without mandating rigid schedules.
Four metrics dominate professional model evaluation. Mean Absolute Error (MAE) reports the average size of errors in the same units as the forecast. Root Mean Square Error (RMSE) penalizes large errors more heavily, useful when a single bad forecast carries outsized consequences. Mean Absolute Percentage Error (MAPE) normalizes errors across markets with different price scales. Directional accuracy asks the simpler question: did the model correctly call up versus down? A model can show low MAPE but still be directionally wrong at critical turning points.
Walk-forward validation is the professional standard for temporal real estate data. The method trains a model on a historical window, tests it on the immediately following period, then rolls the window forward — repeating sequentially. A simple train/test split is insufficient because it can inadvertently expose the model to future data during training, producing accuracy scores that don't hold in live conditions. Walk-forward validation replicates how a forecasting model would actually be deployed, period by period, making its performance metrics far more reliable.
Forecasting methods vary sharply by market, driven by data availability, regulatory structure, and the demographic forces that dominate each economy.
Data depth is the first dividing line. The US and UK publish dense public transaction records — the UK's Land Registry releases every residential sale price — giving forecasters a reliable baseline. Germany, Japan, and most of Southeast Asia rely on fragmented or proprietary datasets, which pushes analysts toward survey-based and agent-reported indices that carry more noise.
Regulatory structure adds another layer of complexity. Markets with active rent control — Berlin, Amsterdam, and New York — require forecasters to model regulatory scenarios alongside market fundamentals. A US suburban market rarely needs that additional variable, which means models built for one context transfer poorly to the other.
The dominant forecast drivers also differ by development stage. In high-growth markets like India, Vietnam, and Nigeria, population growth and urbanization rates set the trajectory. In Japan and Germany, demographic decline and shrinking household formation are the primary variables — the opposite problem entirely.
Climate risk is the trend reshaping forecasting across all markets. According to the US Environmental Protection Agency's climate indicators, the frequency and severity of extreme weather events is increasing — a trend that directly affects property valuations. The EU's Sustainable Finance Disclosure Regulation (SFDR) already requires real estate funds to integrate climate risk scoring into valuations. US lenders are beginning to follow. Forecasters who exclude flood, heat, and wildfire exposure from their models will produce systematically optimistic valuations by 2030.
Office vacancy forecasting offers a clear illustration. London and Singapore have produced more accurate post-2020 forecasts than US gateway cities because their return-to-office rates give models a stable signal — London reached roughly 70% occupancy while San Francisco remained near 45% as of 2024. That gap in physical attendance data directly affects forecast reliability.
For corporate real estate leaders managing multi-country portfolios, this variance matters. Platforms like Upflex address the attendance-signal problem directly: its UnifyAI engine forecasts office attendance with 97% accuracy, giving real estate teams the utilization data they need to make portfolio decisions, regardless of which market the office sits in.

No single method wins outright — the most accurate forecasts combine machine learning models with traditional econometric inputs like interest rates, employment data, and supply metrics. ML models trained on large transaction datasets consistently outperform single-variable regression in volatile markets. For corporate real estate specifically, AI-driven attendance forecasting tools — such as Upflex's UnifyAI engine, which achieves 97% attendance prediction accuracy — apply the same ensemble logic to workplace demand, giving portfolio decisions a data foundation that gut instinct and spreadsheets cannot match.
Most reliable property market forecasts cover a 6-to-18-month horizon; accuracy drops sharply beyond two years. Short-term forecasts (under 12 months) benefit from stable leading indicators like mortgage application volumes, pending home sales data [2], and building permit counts. Beyond 18 months, macro shocks — rate cycles, policy changes, demand shifts from hybrid work — introduce compounding uncertainty that even sophisticated models struggle to price in reliably. Treat long-range forecasts as directional signals, not precise targets.
The National Association of Realtors publishes monthly existing-home sales, median prices, and pending sales data [2] at no cost. The U.S. Census Bureau provides housing starts and new home sales figures. The Federal Reserve's FRED database covers mortgage rates, vacancy rates, and construction spending. For commercial real estate, CoStar offers limited free market snapshots, and local county assessor records supply transaction-level data. Combining three or more of these sources gives a model enough signal to identify directional trends.
Hybrid work has made corporate real estate demand harder to forecast because office utilization no longer tracks headcount — it tracks attendance patterns, which vary by team, day, and policy. Enterprises now report average office utilization rates of 30–50%, meaning traditional square-footage-per-employee formulas overstate space needs. Platforms that forecast actual attendance, rather than theoretical capacity, give corporate real estate leaders the data to right-size portfolios with confidence, rather than relying on lease renewal cycles as a proxy for demand signals.
A forecast projects future market conditions — price direction, demand levels, vacancy rates — over a defined time horizon. An appraisal establishes the current market value of a specific property at a specific point in time, based on comparable sales and income analysis. Forecasts inform strategy; appraisals inform transactions. The two are complementary: a forecast tells you whether to buy, hold, or exit a market, while an appraisal tells you what a specific asset is worth today.
Effective real estate forecasting is only as useful as the decisions it drives. Three things determine whether your forecast actually moves the needle: the quality of your input data, the time horizon you're modeling against, and whether your model accounts for behavioral shifts — particularly the hybrid work patterns that have decoupled headcount from space demand.
For corporate real estate leaders, the most immediate action is auditing your current utilization data. If your attendance figures still come from badge swipes and calendar invites, your forecast baseline is already compromised. Start there, then layer in AI-driven attendance modeling to close the gap between what your lease portfolio assumes and what your teams actually do.
Explore more from our content library: