Share This Article
No items found.

Understanding how to measure office utilization is essential. You can measure office utilization without sensors by combining three data sources you likely already have: badge access logs (who entered the building and when), desk or room booking systems (what was reserved), and periodic manual walk-throughs (what was actually occupied versus booked). Cross-referencing these gives you a usable picture of peak days, no-show rates, and underused space, occupancy tells you who came in, utilization tells you whether the space they used matches the space you're paying for. Start by pulling 4-6 weeks of badge and booking data before drawing conclusions, since single-week snapshots miss normal variation.
Occupancy counts people, how many badged in or were physically seen on a given day. Utilization is a ratio, how much of your available or booked space actually got used. Confusing the two is the first mistake that derails any attempt at how to measure office utilization.
A full building doesn't mean a well-used building. Picture 400 employees badging into a 500-desk floor on a Tuesday, occupancy looks strong at 80%. But if 300 of those people cram into one open-plan zone near the kitchen while two entire wings sit empty, utilization in those unused zones is near zero. A corporate real estate leader looking only at the occupancy number would conclude the office is working fine and keep paying for all 500 desks, when the real story is that half the floor plan doesn't match how people actually work.
This is exactly how hybrid work planners end up holding onto underused real estate. High daily attendance gives leadership false confidence that the square footage is justified, masking the fact that entire neighborhoods, rows, or floors go untouched week after week.
Headcount trends answer one question: when do people come in? Utilization answers a different one: does the space match how they actually work once they're there? For a hybrid team, those are separate decisions. Knowing that attendance peaks midweek tells you nothing about whether your 12 conference rooms or 200 assigned desks are the right mix, the right size, or in the right location. You need both answers before you can right-size a lease or consolidate floors with any confidence.
Occupancy trends show up as attendance curves, a classic Tuesday-through-Thursday spike with quiet Mondays and Fridays [3]. That curve tells you which days to staff reception or stock the kitchen. It doesn't tell you that the spike is concentrated in one collaboration zone while assigned desks three rows over sit empty all three days. Only utilization data, tracked by desk, room, and zone rather than by headcount, exposes that mismatch, and it's the mismatch, not the attendance curve, that should drive your next space decision.
Combine badge access logs, booking system records, and scheduled manual headcounts, and you get a working picture of office use without buying a single sensor. The data already exists inside systems your facilities and IT teams run every day. The work is in pulling it together consistently and checking it against reality.
Three sources cover most of what you need, and each one fills a gap the others leave open. Badge or access control exports tell you when someone entered a building or floor, which gives a reliable count of daily presence but says nothing about where people actually sat or which desks sat empty [5]. Desk and room booking system logs tell you intended use, who reserved what, and when, but a booking doesn't confirm anyone showed up [3]. Scheduled manual headcounts, done by walking a floor at set times, verify what's actually happening at that moment and catch the gap between booked and occupied space that the other two sources miss [4].
No single source answers the full question of how to measure office utilization on its own. Badge data, booking logs, and manual counts each capture a different layer: who's in the building, who planned to use the space, and who's actually sitting in it right now.
Start with badge data. Pull at least eight to twelve weeks of historical access records by floor or zone, since a single week won't reveal whether Tuesday's 70% turnout is routine or an anomaly. Overlay booking records for the same date range next, matching desk and room reservations to the badge timestamps so you can see where booked space and actual entries diverge.
Run a short manual observation period last, typically two to three weeks, to calibrate the gap between what badge and booking data suggest and what's physically happening on the floor. This step is what turns two imperfect data sets into a defensible baseline rather than a guess [5].
Scale the manual piece with fixed-time spot-check rounds, for example, three walkthroughs a day at 10 a.m., 1 p.m., and 3 p.m., rather than continuous monitoring, which a small facilities team can't sustain. A platform like Upflex replaces much of this manual cross-referencing by forecasting attendance directly from scheduling and booking inputs, reaching 97% accuracy without new hardware.
Set expectations before you start. Badge data tends to over-count presence, since one swipe can represent a brief visit. Booking data over-counts intended use, because no-shows and ghost bookings inflate reserved capacity [4]. Manual counts under-sample time, catching only the moments someone walked the floor. Combined, the three sources correct for each other's blind spots better than any one used alone.
Five or six specific metrics turn raw badge and booking data into decisions about floors, leases, and seat counts. Collecting data without calculating these is the most common reason office utilization projects stall after the first dashboard.
Booking-to-show rate compares how many desks or rooms were reserved against how many were actually occupied, and a persistent gap between the two numbers is a diagnostic, not just a nuisance. A 30% gap that holds steady for months points to one of three problems: employees overbooking out of habit, a booking tool nobody trusts enough to update, or hybrid no-shows where plans change after the reservation is made. Each cause has a different fix, so the first step is figuring out which one you're looking at before you touch floor plans.
Peak occupancy tells you the highest share of capacity used during your busiest hour or day, typically Tuesday through Thursday mornings in most hybrid offices. Cost per seat tells you what each desk costs to provision and maintain annually [2]. Pairing the two exposes the real question behind most real estate decisions: if peak occupancy never exceeds 55-60% of capacity, you're paying full cost-per-seat on space that sits empty even on your busiest day. That combination, not average utilization alone, is usually the number that justifies downsizing or consolidation to a CFO.
Weekly patterns show which days cluster high and which stay flat, and that shape matters more than the weekly average [1]. An office running at 70% on Tuesday and 20% on Friday has a scheduling problem, not a space problem, the fix is renegotiating specific days or consolidating onto fewer floors for the quiet end of the week, not shrinking the whole footprint.
Long-term trends require more discipline to read correctly. A single low week after a holiday or a storm looks identical to the start of a genuine decline, so compare rolling four- or eight-week averages rather than reacting to any one snapshot [1]. This is also where space-type utilization matters: averaging desks, meeting rooms, and collaboration zones into one number hides the fact that desks might run at 40% while meeting rooms stay overbooked at 90% [4]. Platforms like Upflex address this by forecasting attendance patterns with 97% accuracy through its UnifyAI engine, giving real estate and workplace teams a trend they can act on rather than a guess based on last week's headcount.
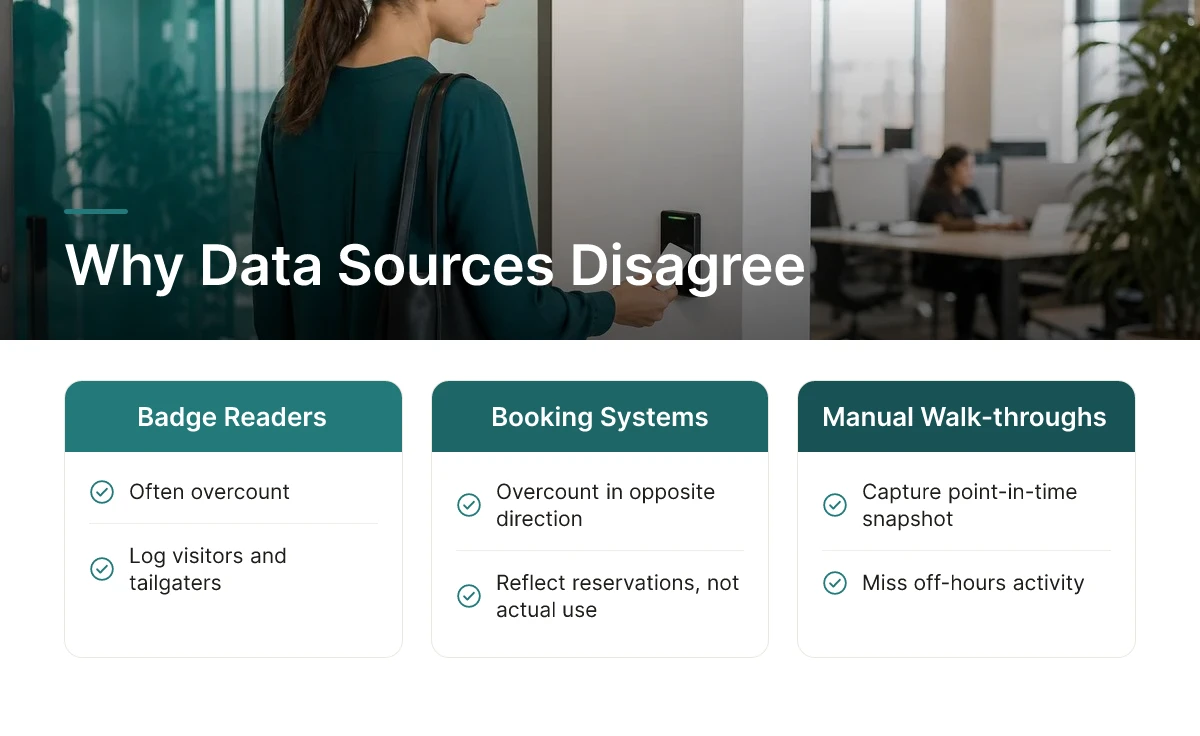
Badge counts, booking systems, and manual walk-throughs will rarely agree on a given day, treat the gaps as information, not noise to average away. Learning how to measure office utilization reliably means learning how to reconcile these mismatches, not pretending they don't exist.
Each data source fails in a different, predictable way. Badge readers often overcount because they log visitors, contractors, and tailgaters who swipe through a door behind an employee without their own credential[5]. Booking systems overcount in the opposite direction, someone reserves a desk Monday morning, then works from home instead, and the booking never gets canceled, leaving a "ghost booking" that looks like a show when no one showed[4]. Manual headcounts undercount because they capture a single moment: someone in a meeting room, on a coffee break, or at a client site when the walkthrough happens won't be counted, even though they used the space that day.
None of these errors is random. They cluster around specific causes, shared building entrances, stale calendar habits, or fixed-time observation windows, which is exactly why cross-checking sources catches problems that trusting one source alone will miss.
Assign each source a distinct role instead of blending them into a single average. Badge data serves as your presence baseline, the closest thing to ground truth on how many people entered the building[5]. Booking data tells you intent, what teams planned, which is useful for forecasting but not for confirming what actually happened. Manual counts become your calibration check, a periodic spot-audit that validates or challenges what the other two sources report.
Rounding all three into one blended figure hides exactly the discrepancy you need to see, a smoothed number can look stable while masking a badge reader miscounting an entire floor. Keep the layers separate so they cross-validate each other over time.
Review the reconciliation weekly during a hybrid rollout and monthly once patterns stabilize. Upflex's UnifyAI engine addresses this by forecasting attendance with 97% accuracy and cross-referencing scheduling inputs against actual utilization data, which narrows the gap between what's booked and what's real before it compounds into a costly square-footage decision.
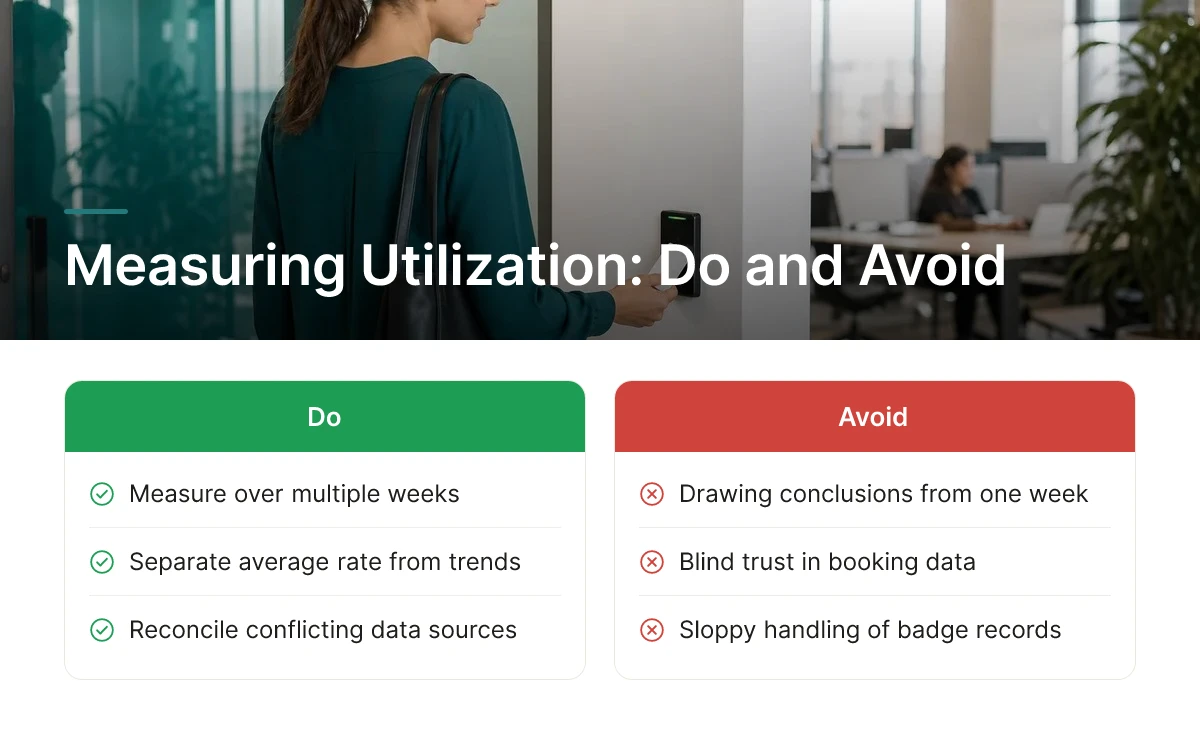
Most failures in how to measure office utilization come down to three errors: too short a measurement window, blind trust in booking data, and sloppy handling of badge records. Each one is fixable once you know to look for it.
The first mistake is drawing conclusions from a single, unrepresentative week. A measurement window that happens to include a holiday, a company offsite, a transit strike, or a snowstorm will produce numbers that look nothing like a typical month. Hubstar's framework addresses this directly by separating average utilization rate from weekly patterns and long-term trends, precisely because a single snapshot can mislead a portfolio decision [1]. Pull at least eight to twelve weeks of data, ideally spanning a full quarter, before you act on it.
The second mistake is treating desk and room bookings as proof that space was actually used. Booking data only tells you what someone intended to do. Deskbird's research flags booking-to-show and no-show rates specifically because ghost bookings inflate perceived demand and skew the entire dataset [4]. Cross-check reservations against badge swings, check-ins, or Wi-Fi connections before reporting a utilization number to leadership, otherwise you risk overstating real demand and protecting square footage that nobody is actually occupying.
Spreadsheets work for a single building with one data source; they break down once you're reconciling badge logs, booking exports, and manual counts across a multi-site portfolio. At that point, a workplace optimization platform that pulls badge, booking, and occupancy data into one dashboard saves real analyst hours and reduces the chance of manual error. When evaluating one, check three things: how many data sources it integrates natively (badge systems, calendar tools, Wi-Fi logs), how flexible its reporting is for different stakeholders (CRE, finance, HR each want different views), and whether it forecasts forward rather than just reporting backward. Upflex, for example, runs scheduling and attendance inputs through its UnifyAI engine to forecast attendance with 97% accuracy, turning raw occupancy data into a forward-looking view that supports portfolio consolidation decisions rather than just historical reporting.
Badge data is individual-level by default, and that creates exposure if handled carelessly. Aggregate or anonymize access logs before they reach a utilization report, nobody needs to see that a specific employee badged in at 8:47 a.m. three Tuesdays in a row. Loop in HR and legal before building any dashboard that touches badge or Wi-Fi data, since what counts as acceptable monitoring varies by company policy and jurisdiction. Getting this sign-off early avoids rework later and protects trust with employees who are, after all, the ones generating the data.
The underlying goal isn't a one-time audit you run before a lease renewal. It's a repeatable process you can rerun every quarter, with consistent definitions and a clean data pipeline, so each measurement is comparable to the last.
No, badge data alone gives an incomplete picture because it records building entry, not desk or room use. A badge swipe tells you someone is in the building, but not which floor, neighborhood, or seat they occupied. Pair it with desk booking or Wi-Fi data for a fuller view [5].
Plan on roughly 30 days of data before drawing conclusions, since most offices show weekly rather than daily patterns [5]. A full month captures Monday-to-Friday swings and at least four occurrences of each weekday, smoothing out one-off events like holidays or offsites.
Yes, manual headcounts still matter because booking systems only show reservations, not actual attendance. No-shows and walk-ins both distort booking data, so periodic physical walkthroughs or spot counts validate whether booked space is actually occupied [4].
There's no universal benchmark, but a large gap between bookings and actual attendance signals unreliable data or ghost bookings [4]. If show rates run consistently low, tighten booking policies or cross-check against badge or Wi-Fi records before making space decisions.
In most enterprises, yes, because badge and Wi-Fi data touch employee privacy and IT security policies. Loop in IT early for data access and legal or HR for privacy review, especially across regions with different workplace monitoring regulations.
Accurate utilization data comes from combining sources, not relying on one. Badge swipes confirm presence, booking systems reveal intent, and manual counts catch the gap between the two [5]. Track the metrics that matter for your decision, average and peak utilization rate, weekly patterns, and booking-to-show rate [1][4], before touching your real estate portfolio. Start with the data you already have. Pull 30 days of badge and booking records this month, compare them against a few manual walkthroughs, and use that baseline to flag which floors or days warrant a closer look before your next lease renewal conversation.
Explore more from our content library: