Share This Article
No items found.


Understanding how to forecast office space needs is essential. Forecasting office space needs means combining your projected headcount growth with real utilization data, not just applying a flat square-footage-per-employee rule. Start with how many people you expect to have by role and team, then adjust that number using actual attendance patterns from badge data, bookings, or sensors, since hybrid teams rarely show up at full capacity on any given day. The resulting plan should set a space target as a range tied to peak co-attendance days, not a single fixed number, and get revisited quarterly as headcount and hybrid patterns shift.
Before you can build any model, gather four inputs: current headcount by team, your hiring plan, your hybrid schedule, and real usage data. Skip any one of these and the forecast will be guesswork dressed up as analysis.
Headcount alone produces a bad forecast because it assumes every employee with a desk shows up every day, and in hybrid environments, almost none do. A team of 200 people on a three-day hybrid schedule doesn't need space for 200; it needs space for whatever the actual peak co-attendance day looks like, which is often far lower. Relying on headcount alone is the single biggest reason real estate teams overbuild, carrying square footage nobody uses [3]. If you don't have sensors installed yet, badge swipe data or calendar and booking records are a reasonable starting point. They're lower-fidelity than dedicated occupancy sensors, they can't always tell you how long someone stayed or which specific desk they used, but they still beat guessing, and they give you directional attendance patterns by day of week and by team [4].
None of this data lives in one place by default, which is why forecasting office space needs requires organizational alignment, not just a spreadsheet. You need HR or people-ops to confirm growth projections are current, and you need team leads to confirm hybrid schedules reflect what's actually happening rather than what the policy document says. Upflex's UnifyAI engine pulls these signals together, scheduling inputs, booking activity, and attendance history, into a single forecast, so real estate and HR leaders aren't reconciling three disconnected data sets before they can even start planning.
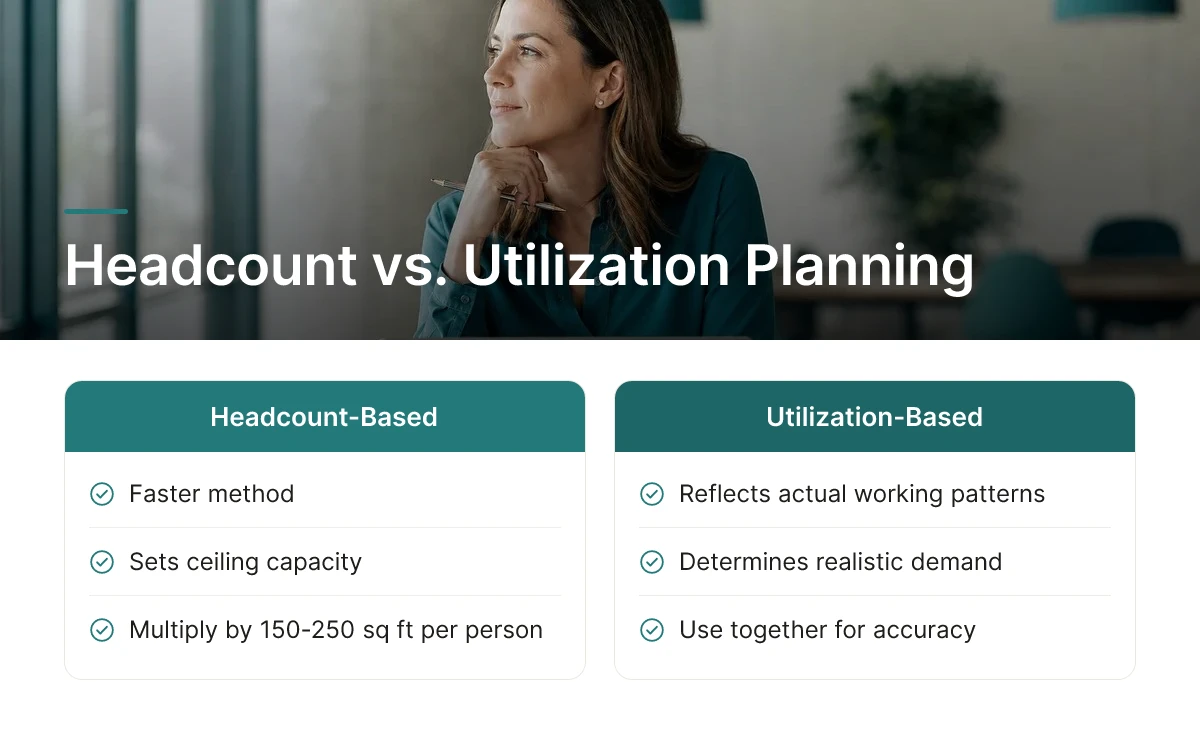
The accurate way to forecast office space needs is to blend two methods: headcount-based planning for the ceiling and utilization-based planning for the working number inside it. Treating these as competing approaches is the most common mistake corporate real estate teams make, and it's why so many portfolios end up either too tight or carrying square footage nobody uses.
Headcount-based forecasting is the faster method. Multiply expected employee count by a space-per-person benchmark, a common planning range sits around 150-250 square feet per person depending on layout and function [4], and you get a square footage target in minutes. The problem is that this method assumes every employee shows up every day. It has no way to account for the fact that hybrid teams might only hit 30-50% occupancy on any given day, which is the range enterprises are now managing against as they reconcile distributed teams with fixed real estate costs.
Utilization-based forecasting works differently. Instead of starting from total headcount, it sizes space to observed peak attendance, the highest realistic number of people in the building on the busiest day, not the full roster. This method is far more accurate for hybrid teams because it reflects how people actually work, but it only works once you have attendance data to analyze. A brand-new office with no booking history gives you nothing to measure.
Badge swipes, desk booking records, and occupancy sensors each capture a different slice of real usage, and combined they reveal the pattern headcount numbers can't show: which days peak, which floors sit empty, and how fast utilization climbs after a return-to-office push [4]. Booking data shows intent, who planned to come in, while badge and sensor data show what actually happened, and the gap between the two is often where the real forecasting insight lives. Most corporate real estate portfolios are still sized off two numbers alone, total headcount and a leadership guess at attendance, while the real demand for desks and meeting rooms looks nothing like that plan [3].
Use headcount-based forecasting when you're planning a new office or expansion with no usage history to draw on, it's the only option available before data exists. Once you've got several months of booking and attendance data, shift to utilization-based forecasting to refine the number and avoid overbuilding. The decision rule is sequential, not either-or: headcount sets the starting assumption, utilization data corrects it.
The combined approach is simple to apply. Headcount growth projections set the ceiling, the maximum space you'd ever need if attendance spiked. Utilization data sets the realistic working number inside that ceiling, which is usually well below it. Upflex's UnifyAI engine forecasts attendance at 97% accuracy specifically to replace the guesswork in that second step, giving real estate and finance leaders a defensible number instead of a benchmark-driven estimate.
A workable model for how to forecast office space needs segments headcount by team type, sizes space to peak co-attendance days rather than averages, and adds a growth buffer. Skip any one of these three elements and the forecast will drift out of date within a quarter.
Start with team segmentation. A fully in-office sales team, a hybrid engineering team with a Tuesday/Wednesday anchor, and a remote-first customer support team each have a different realistic attendance ceiling. Applying one flat ratio, say, "70% of headcount", across all three erases the differences that actually determine how much desk and meeting room capacity you need on any given day [3]. Instead, group employees by their actual work pattern and assign each segment its own expected attendance range, built from badge data, desk booking records, or VPN logs where available.
Next, model peaks instead of averages. Most hybrid teams converge on the same two or three days, often midweek, which means your busiest day, not your average occupancy, sets the real space requirement [4]. A portfolio that averages 45% utilization across the week can still hit 85% on a Wednesday if every team's anchor days overlap. Planning to the average guarantees a space shortage on exactly the days that matter most to employees and to any return-to-office commitment leadership has made. Finally, build in a buffer. Headcount growth, seasonal hiring, and unplanned policy shifts, like a new mandatory anchor day, will change attendance patterns faster than most quarterly real estate reviews can track [1]. A buffer of roughly 10–15% on top of your peak-day calculation absorbs this variability without forcing a full model rebuild every time a department adds staff.
The workflow looks like this in practice:
This is the kind of layered calculation that Upflex's UnifyAI engine automates, pulling scheduling inputs and utilization data together to forecast attendance with 97% accuracy and flag peak co-attendance days before they become a capacity problem.
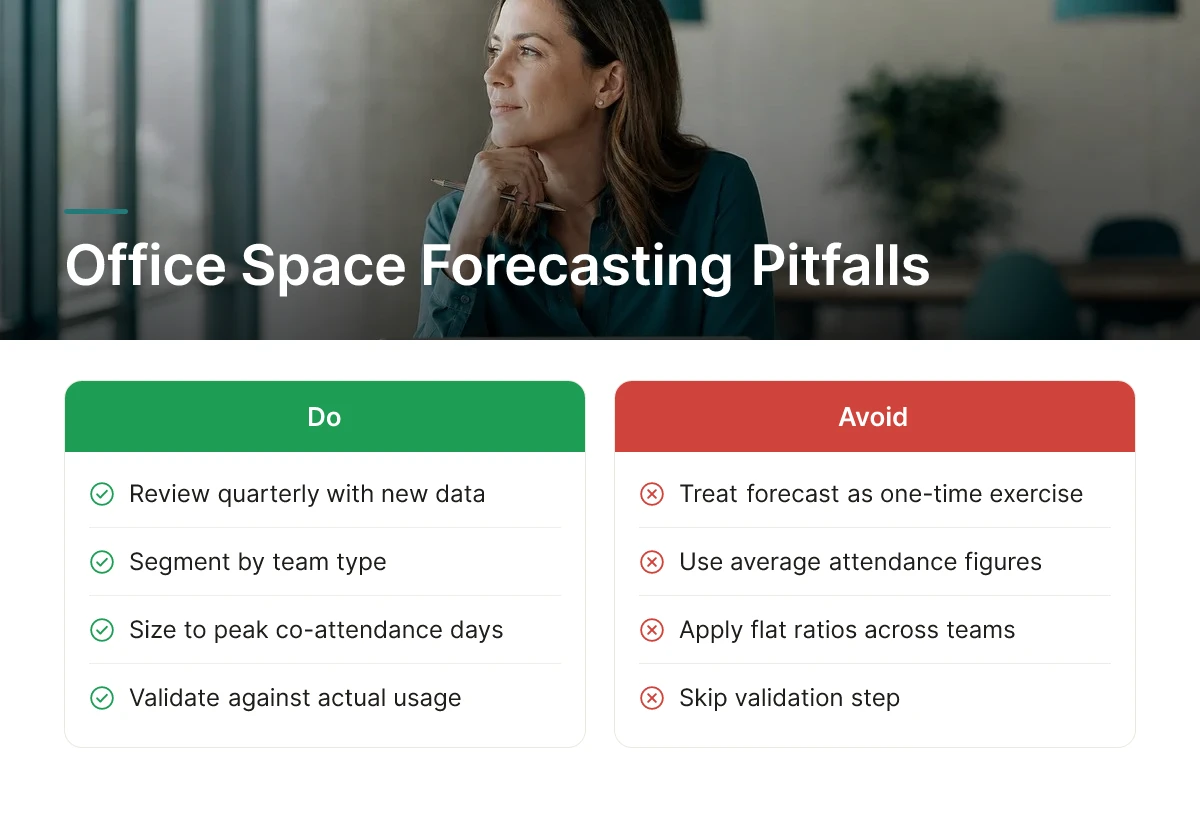
Three mistakes account for most forecasting failures. The first is assuming uniform attendance across every team, which overstates space needs for remote-first groups and understates them for in-office-heavy functions. The second is planning to average utilization instead of peak-day demand, which looks efficient on paper and fails the moment real employees show up on the same Tuesday. The third is leaving the model static after a policy change, adding a mandatory anchor day, for instance, without re-running the segment-level ratios, which quietly turns an accurate forecast into a stale one within a single budget cycle.
Check forecast accuracy by comparing predicted peak attendance against what actually happened over a full quarter, then feed the gap back into your model before the next planning cycle.
A forecast is only useful if it holds up against reality. Pull your projected peak-day attendance numbers from the quarter and line them up against badge swipes, desk bookings, or sensor data for the same period. If your model predicted a Tuesday peak of 72% occupancy and actual utilization topped out at 58%, that's not a rounding error, it's a signal worth investigating.
A meaningful gap almost always points to one of three problems. First, the space itself may be overbuilt relative to real demand, which happens often in portfolios still sized off headcount rather than measured attendance patterns [3]. Second, hybrid adoption may be running ahead of what the original model assumed, teams that were expected to come in three days a week settled into two. Third, a policy change, like a new manager mandating specific anchor days, may have shifted behavior without ever being entered into the forecast inputs. Each cause demands a different fix: shrinking the footprint, adjusting the coordination strategy, or simply updating the model's assumptions.
This is also where the exercise of learning how to forecast office space needs stops being a one-time project and becomes an operating habit. A quarterly review cadence works well for most hybrid organizations, since it's frequent enough to catch headcount changes, new hires, attrition, and policy shifts before they compound into a stale plan, but not so frequent that you're reacting to noise. Organizations relying on static annual reviews tend to discover the mismatch only when a lease renewal forces the question [2], by which point the gap has often grown too large to fix without disruption.
Platforms built for continuous recalibration make this easier than manual quarterly audits. Upflex's UnifyAI engine, which forecasts attendance at 97% accuracy, compares its own predictions against actual booking and check-in data on an ongoing basis, so the forecast improves automatically instead of drifting out of date between formal reviews.
The payoff for staying current shows up on the balance sheet. Right-sizing space to validated demand means you're no longer paying to heat, clean, and lease square footage nobody uses, unused capacity converts directly into lower operating and lease costs once the portfolio reflects how teams actually show up, not how a spreadsheet once assumed they would.
Most forecasts fail for the same five reasons: stale data, averaged attendance, flat ratios, skipped validation, and single-source blind spots. Knowing how to forecast office space needs also means knowing where the process typically breaks down.
Upflex's UnifyAI engine addresses several of these failure points directly by forecasting attendance at 97% accuracy and refreshing predictions continuously rather than producing a static, point-in-time number. That combination of continuous validation and team-level granularity is what separates a forecast that holds up at lease renewal from one that gets quietly revised every six months.
There is no fixed number, it depends on your actual attendance patterns, not headcount alone. A benchmark figure per person is a useful starting point, but hybrid offices should size around peak-day occupancy and desk-sharing ratios rather than one static figure [4]. Teams with three in-office days per week need a very different ratio than teams that come in daily, so the right answer comes from measured usage, not a textbook rule [5].
Square footage rules assume every employee occupies a desk every day, which hybrid work makes false [4]. Real demand varies by day of week, team, and season, floors sit empty on Mondays and overflow by Wednesday [3]. A static ratio can't capture that swing, which is why forecasts built on actual booking and badge data outperform headcount-based math [5].
There's no universal percentage, patterns differ by function, and that's the point of forecasting rather than guessing. Sales or field teams might average low weekly attendance, while product and engineering teams cluster around mid-week peaks. Instead of applying one assumption across the portfolio, build the model from each team's measured attendance history and projected headcount growth [3]. Tools like Upflex's UnifyAI forecasting engine generate these team-level predictions at 97% accuracy, which removes the guesswork from setting per-team ratios.
Compare forecasted attendance against actual utilization data over several months, not just the first few weeks. Track whether peak-day occupancy matched predictions and whether co-attendance targets were met, Upflex customers track this against an 88% co-attendance benchmark. Persistent gaps above a small margin signal the model needs recalibration against fresher booking and badge data.
Organizations that right-size based on verified attendance data, rather than headcount, commonly cut real estate spend by 40% or more. The savings come from consolidating underused floors and renegotiating leases with occupancy data as use, not from mandates that force attendance [2]. Results vary by portfolio size and lease terms.
Forecasting office space needs accurately comes down to three habits: basing projections on measured attendance rather than headcount, modeling team-level patterns instead of one portfolio-wide ratio, and revisiting the forecast regularly as hybrid schedules shift [3][5]. Leaders who skip straight from headcount to square footage end up with the Monday-empty, Wednesday-crowded problem that undermines both cost control and employee experience [4]. The next step: pull your last two quarters of badge or booking data, segment it by team, and compare it against your current lease commitments before your next renewal decision, that gap is where your real forecast begins.
Explore more from our content library: