Share This Article
No items found.


Office space underutilization occurs when a company pays for more physical workspace than its employees actually occupy or use on a regular basis. It is driven by hybrid work adoption, legacy lease commitments, and poor visibility into real occupancy patterns. Left unaddressed, underutilization converts square footage directly into wasted overhead, inflating real estate costs without delivering proportional value to the business.
Office space underutilization is the gap between the square footage a company pays for and the square footage employees actually occupy on any given day.
That gap exists across three distinct layers. First, there is allocated space, everything a company leases or owns. Second, there is assigned space, what is formally designated to teams, departments, or individual desks. Third, there is occupied space, what employees actually use when they show up. Most underutilization analysis focuses only on the first layer, which is why the problem persists: the real waste lives in the distance between all three.
Hybrid work created a structural mismatch that makes this gap worse. Headcount stays the same, but peak-day attendance drops sharply. A floor plan built for 300 daily occupants may see 90 people on a Tuesday and 210 on a Thursday, leaving large portions of the building empty for most of the working week [3].
Return-to-office mandates have not reliably closed this gap. Without data on which teams attend on which days, employees cluster on the same two or three anchor days. The result is a utilization spike mid-week and near-empty floors on Mondays and Fridays, the same pattern, just slightly compressed.
Several structural factors consistently drive office space underutilization across organizations of all sizes. Research into the root causes of office space underutilization points to a recurring set of contributors:
Some companies maintain oversized, premium-looking offices as status signals rather than operational tools, a pattern sometimes called "office peacocking." The motivation is brand perception: a flagship headquarters in a prime district signals financial health and attracts talent. The cost is carrying far more leased square footage than actual headcount or attendance patterns justify.
This inflates the allocated space layer well beyond genuine need, making office space underutilization a deliberate design choice rather than an oversight.
Before hybrid work normalized, long-term leases made sense, headcount and attendance were predictable. Companies signed 10- to 15-year agreements calibrated to five-day-a-week occupancy. Those commitments now lock organizations into space volumes that no longer match actual demand [3].
The lease trap converts underutilization from a temporary anomaly into a fixed structural cost. A company cannot simply hand back floors mid-lease. Until the agreement expires, every empty desk represents overhead with no operational return, and no amount of return-to-office messaging changes the underlying math.
Measuring office space underutilization requires three core metrics, reliable sensor data, and at least several weeks of continuous observation before any conclusions hold. A thorough guide to office space utilization and efficiency outlines how organizations can build a measurement framework that goes beyond simple headcounts.
Start with three foundational numbers. Utilization rate measures the percentage of available seats or spaces in active use during working hours. Occupancy rate compares headcount to total building capacity. Peak vs. average occupancy shows the difference between your busiest moment and a typical hour.
That last distinction matters more than most teams realize. Sizing a portfolio around peak occupancy, the one Tuesday in March when every desk was full, systematically overstates how much space you actually need. Average occupancy across a full quarter is a far more honest baseline for real estate decisions.
Data collection fidelity varies significantly by method. Manual headcounts are low-cost but capture only a snapshot. Desk booking systems record reservations, not actual use, a booked desk that goes unoccupied still looks "used" in the log. Wi-Fi presence detection improves coverage but can't distinguish a person at a desk from a phone left charging. IoT occupancy sensors, motion or thermal, offer the highest fidelity, tracking whether a specific seat, room, or zone was physically occupied throughout the day.
Segment the data before drawing conclusions. Building-level averages hide the pockets of chronic underuse that drive the most correctable waste. Break utilization down by day of week, floor, zone type (focus desks, collaboration rooms, phone booths), and team. A floor that averages 60% utilization may contain a collaboration zone running at 20% and a focus area that's routinely oversubscribed.
Badge-in or door-count data tells you people entered the building. It tells you nothing about whether a specific desk, room, or zone was actually used [3]. This gap, between building entry and verified space use, is where the real waste hides inside the floor plate.
A company tracking only building entry might report 75% occupancy while half its desks sit empty all morning. Sensor or booking data closes that gap by confirming actual use at the space level, not just the building level.
Establishing a utilization baseline requires continuous data collection across several weeks minimum. Short measurement windows distort the picture in two predictable ways: seasonal variation (summer Fridays, holiday weeks) and anchor-day clustering, where employees concentrate attendance on two or three days per week, inflating midweek figures while masking chronic underuse on either side. Platforms like Upflex address this directly, the UnifyAI engine processes attendance patterns continuously to forecast who is coming in, when, and where, giving real estate leaders a baseline built on weeks of actual behavior rather than a single snapshot audit.
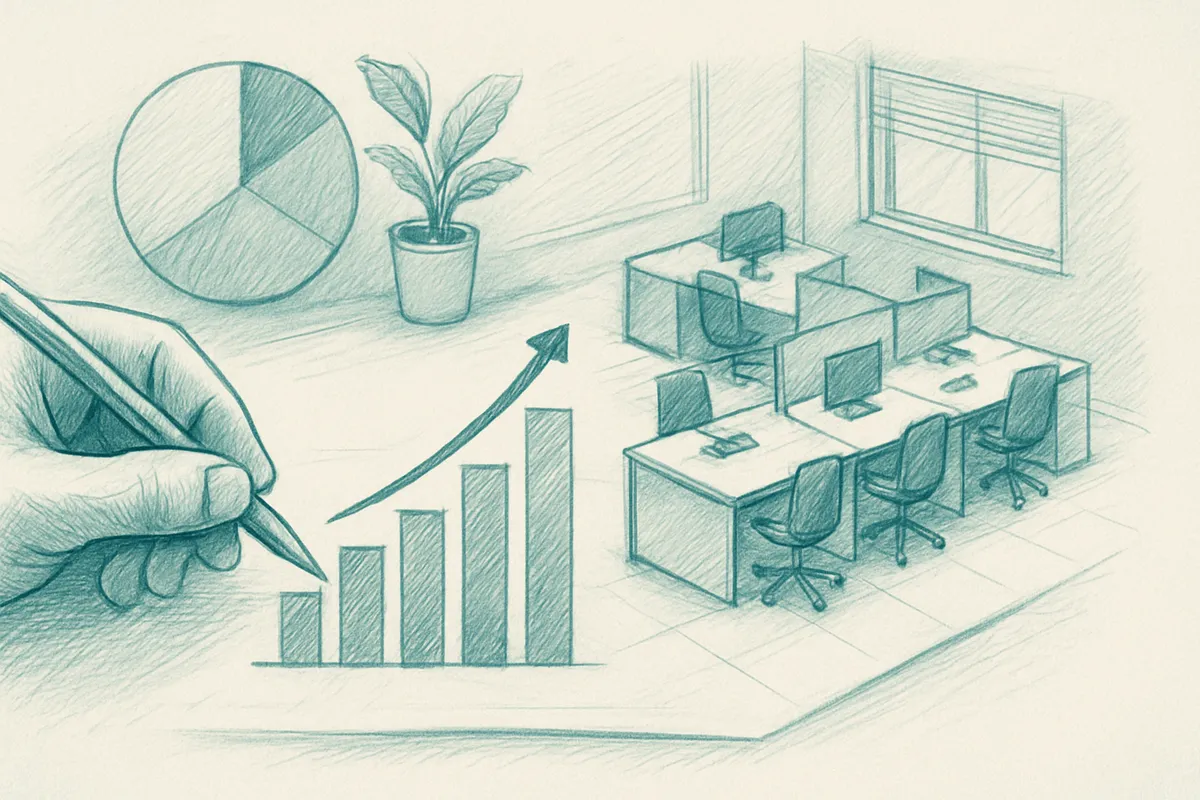
Office space underutilization costs far more than wasted rent, every empty desk pulls utilities, facilities management, IT, cleaning, and insurance spend with it.
Each of those line items scales with leased square footage, not actual occupancy. A floor sitting at 40% capacity still draws full HVAC cycles, full cleaning contracts, full network infrastructure maintenance, and full property insurance premiums. Facilities management contracts are typically structured around the total area under lease, so a company paying for 50,000 square feet absorbs the cost of all 50,000, regardless of how many employees showed up that week.
Meeting rooms compound the problem. A 12-seat conference room booked for a two-person call represents some of the highest cost-per-actual-user waste on a typical floor plan. Those rooms consume disproportionate square footage, dedicated AV infrastructure, and premium interior fit-out, yet utilization data consistently shows them among the least efficiently used spaces in any office.
The opportunity cost is equally significant. Capital and management attention tied up in administering excess space, renegotiating vendor contracts, managing facilities tickets, maintaining underused infrastructure, is capital and attention not directed at headcount, product development, or growth. The true cost of underused office space extends well beyond the rent line — it is a strategic drag, not just a facilities problem.
The ROI model starts with a fully-loaded cost-per-seat figure: total real estate overhead (rent, facilities, utilities, cleaning, IT, insurance) divided by the number of seats in the portfolio. Once utilization data reveals actual peak occupancy, you can model the reduction in seats genuinely required. That seat reduction maps directly to consolidation opportunities, either exiting a lease, reducing leased area at renewal, or generating sublease revenue from surplus floors.
Upflex's utilization reporting gives corporate real estate teams the occupancy data needed to build that model with confidence, with documented outcomes of 40%+ reduction in real estate spend for organizations that act on the findings.
Replacing permanently leased overflow space with on-demand workspace access converts a fixed monthly obligation into a cost that scales with actual usage. When a team needs a workspace in a city where you hold no lease, paying for that day's access costs a fraction of maintaining a permanent footprint for occasional use.
This matters most during demand fluctuations, hiring surges, project peaks, or post-consolidation transitions, where locking into new long-term leases creates the same underutilization problem all over again. A variable cost model keeps real estate spend proportional to real occupancy, which gives finance leaders the budget predictability that fixed leases structurally cannot provide.
Reducing office space underutilization requires four sequential steps: audit, demand profile, right-size, then restructure how teams use the space.
Step 1, Space audit. Map every zone on your floor plate and assign each a type: focus, collaboration, social, or support. Attach a cost-per-square-foot figure to each zone. That financial baseline is what makes consolidation or reconfiguration decisions defensible to your CFO, without it, you're negotiating on opinion.
Step 2, Demand profiling. Collect at least four weeks of occupancy data, segmented by day, zone, and team. The output you're after is a utilization heat map, not a single average occupancy rate. A single average hides the reality that your focus rooms may run at 15% capacity on Mondays while your collaboration zones are oversubscribed on Wednesdays.
Step 3, Right-sizing decisions. Match the demand profile to three levers. Reconfigure underused zones into higher-demand types, convert rows of empty assigned desks into collaboration areas. Consolidate by exiting floors or buildings where utilization is chronically low. Flex by replacing fixed overflow capacity with on-demand workspace access; platforms like Upflex give employees access to a global network of third-party workspaces, eliminating the need to hold square footage for peak days that rarely materialize.
Change management is a prerequisite, not an afterthought. Space optimization fails when employees don't understand the new protocols or managers haven't bought in. Showing teams their own utilization data, rather than issuing a top-down mandate, is consistently more persuasive. Data transparency converts skeptics into participants.
Step 4, Neighborhoods and activity-based working. Moving from assigned desks to team neighborhoods with unassigned seating ratios aligned to actual attendance patterns is the structural change that sustains utilization gains. If your data shows a team averages 60% in-office attendance, a 0.7:1 desk-to-person ratio gives that team adequate space without carrying idle desks year-round.
Upflex's UnifyAI engine forecasts attendance with 97% accuracy, which means neighborhood ratios can be set against real predicted demand rather than guesswork. Booking protocols, clear neighborhood assignments, and manager accountability for co-attendance targets, tracked through tools like Upflex's co-attendance achievement reporting, are what keep the model working after launch.
Solving office space underutilization requires three technology layers: data capture, data aggregation, and action enablement, each building on the last.
Layer one, data capture, includes IoT occupancy sensors, desk booking systems, Wi-Fi analytics, and badge readers. These tools establish the raw signal: who entered the building, which desks were reserved, and which zones showed actual physical presence.
Layer two is aggregation and visualization. Workplace analytics dashboards pull that raw signal into utilization trends by zone, day, and team, turning a flood of sensor pings into readable patterns that real estate and facilities leaders can act on.
Layer three is action enablement: platforms that connect utilization data directly to booking workflows, scheduling decisions, and portfolio-level real estate choices. This is where data stops being a report and starts driving decisions.
The critical gap sits between layers one and three. A desk booking tool that doesn't feed data into a portfolio dashboard forces manual reconciliation, producing the same blind spots as having no technology at all.
When comparing solutions, evaluate the following criteria:
AI-driven forecasting adds a fourth layer, moving from descriptive reporting on last week's occupancy to predicting how many people will arrive Thursday and which zones they'll need. Upflex's UnifyAI engine, for example, forecasts attendance with 97% accuracy, converting historical utilization data into proactive space decisions rather than retrospective audits.
The build-vs-buy question comes down to data coherence. Stitching together a sensor vendor, a booking tool, and a separate analytics platform creates reconciliation overhead and gaps at every handoff. An integrated workplace management platform, where capture, aggregation, and action share a single data model, reduces that overhead and lowers total cost of ownership over time, even when the upfront evaluation feels more complex.
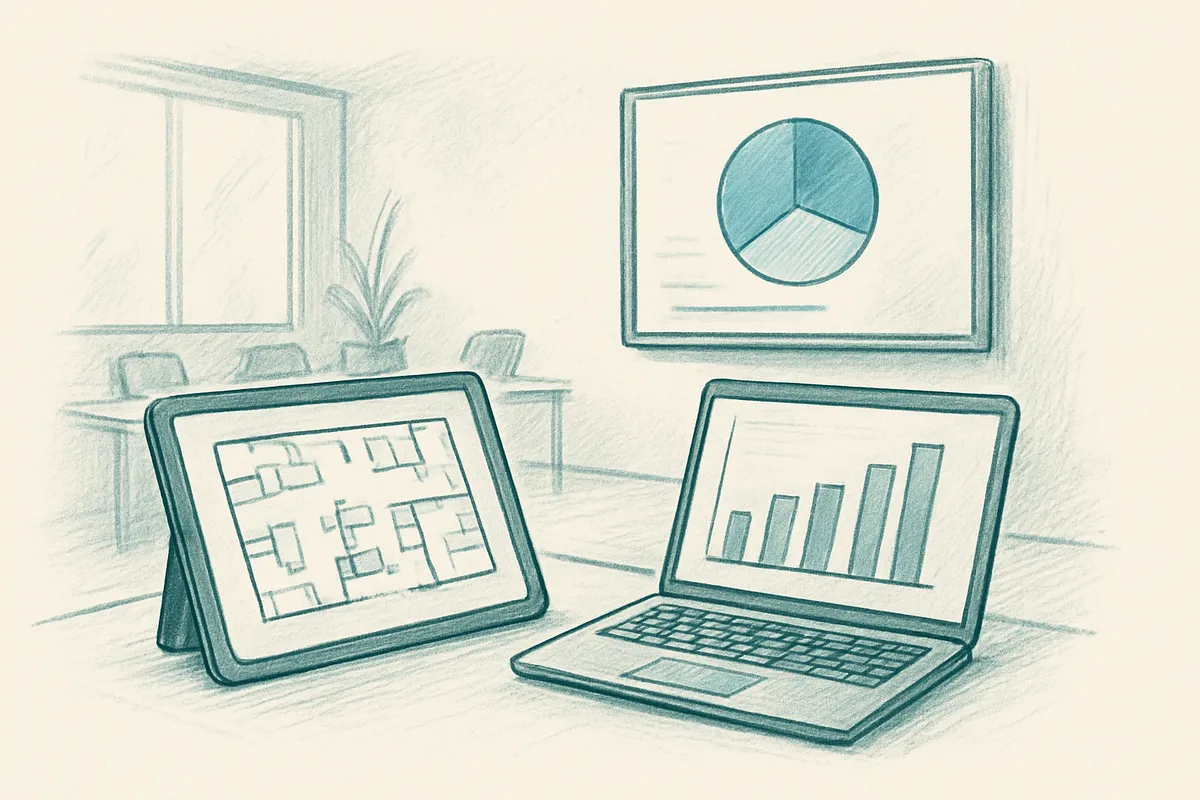
A utilization rate between 60% and 70% is generally considered healthy for a modern hybrid office. Rates below 40% signal significant waste, you are paying for space that sits empty most of the week. Rates consistently above 80% can indicate overcrowding, which creates friction for employees trying to find desks. The right target depends on your lease structure, headcount, and how many days per week your teams are expected on-site.
Hybrid work typically reduces average daily occupancy to 30–50% of total capacity, creating a persistent gap between space leased and space actually used [3]. The bigger problem is unpredictability: attendance clusters on certain days, usually Tuesday through Thursday, leaving Monday and Friday nearly empty. Without accurate forecasting, real estate teams cannot right-size their portfolios because they have no reliable data on which days demand is real and which days the office will sit vacant.
Occupancy rate measures how many seats are filled at a given moment; utilization rate measures how often a space is used across a defined period. A meeting room can show 100% occupancy during a Tuesday call and 0% for the rest of the week, its utilization rate might be just 15%. Both metrics matter, but utilization gives a more accurate picture of whether your real estate portfolio is earning its cost.
A basic space audit, badge data review, sensor deployment, and initial reporting, typically takes four to eight weeks for a single office location. Larger portfolios with multiple sites can take three to six months to produce reliable utilization baselines. The timeline depends heavily on whether sensor infrastructure is already in place and whether your booking and badge data are centralized or scattered across disconnected systems.
Yes, for most overflow needs, on-demand workspace access is a direct substitute for permanently leased secondary space. Rather than signing a long-term lease to cover peak-day demand, organizations can give employees access to third-party workspaces on the days they need them. Upflex's global on-demand workspace network is built exactly for this scenario, employees book external space when the primary office is at capacity, eliminating the cost of carrying square footage that sits empty the other four days of the week.
Office space underutilization is not a facilities problem, it is a data problem. Most organizations are paying for space they cannot see clearly, on leases signed for a workforce that no longer shows up five days a week. Three actions move the needle: deploy occupancy sensors to build an honest utilization baseline, identify which space types are chronically empty rather than cutting headcount indiscriminately, and replace fixed overflow capacity with on-demand access that scales with actual attendance.
If a lease renewal is approaching, that decision point is your clearest opportunity to act on the data. Run a utilization audit on your current portfolio now, before you sign, and let the numbers determine how much space you actually need.
Explore more from our content library: