Share This Article
No items found.

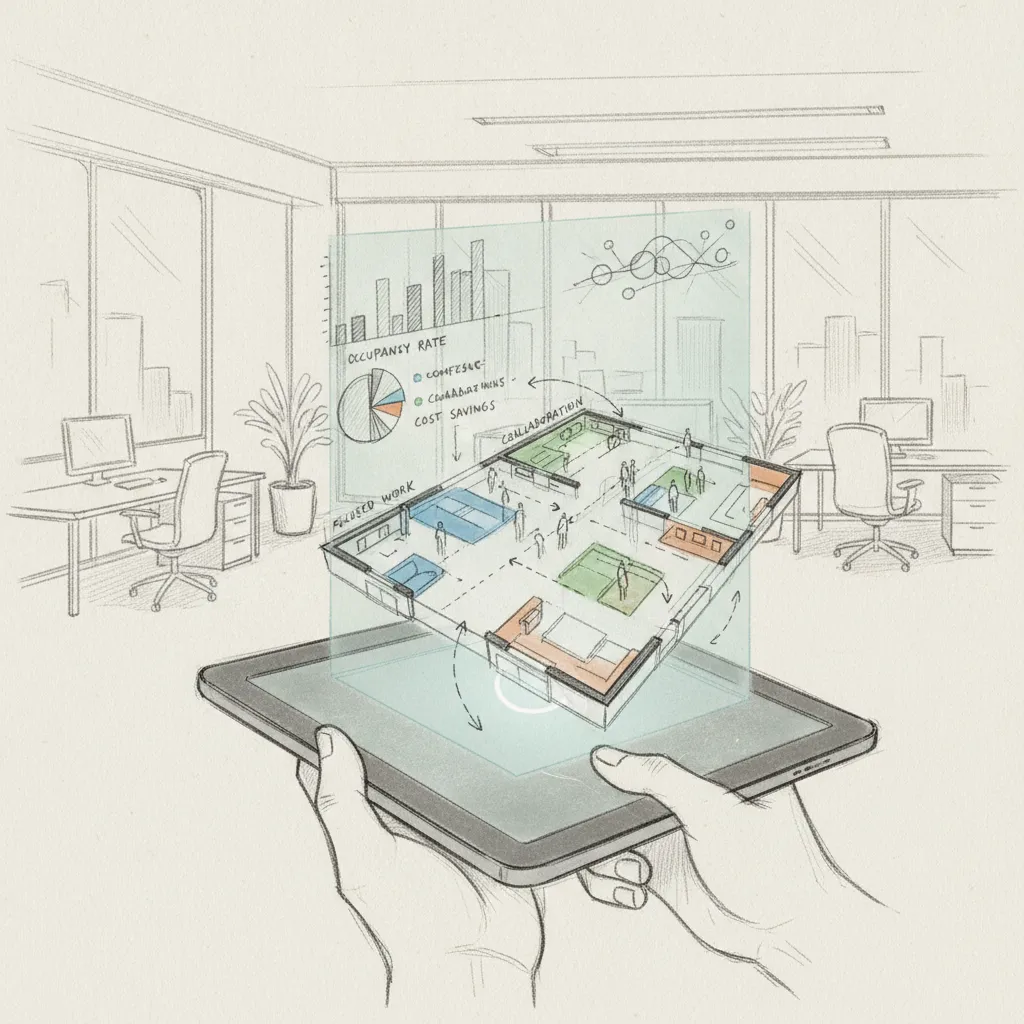
Space utilization software tracks, analyzes, and optimizes how physical space is used across offices, campuses, or real estate portfolios, using occupancy sensors, badge data, and booking systems to surface real-time and historical usage patterns. Organizations that deploy it typically cut real estate costs by 30–40%, eliminate ghost reservations, and make data-backed decisions about consolidating or redesigning space rather than guessing from headcounts alone.
This category of workplace technology collects occupancy signals from physical and digital sources, processes them through an analytics engine, and outputs metrics that tell you exactly how your space is being used.
The data inputs span IoT occupancy sensors, Wi-Fi probe counts, badge readers, and desk or room booking systems. Together, these sources generate raw signals that the platform converts into metrics your real estate team can act on, peak occupancy percentage, average seat density, and ghost bookings (reservations made but never occupied). According to FacilityForce, integrating multiple data streams is essential for achieving accurate, actionable occupancy insights.
Traditional space management relies on spreadsheet headcounts and annual space audits. Those methods produce a snapshot, accurate once a year, stale the other 364 days. Modern occupancy analytics platforms deliver continuous, room-level data with accuracy rates above 95%.
The architecture behind that accuracy runs three layers deep. First, a data collection layer pulls from IoT sensors, calendar integrations, and access control systems. Second, an analytics engine processes those feeds into real-time dashboards and trend models. Third, an action layer converts the analysis into automated alerts and space reconfiguration recommendations, so your team acts on insight, not instinct.
One distinction worth keeping clear: space utilization software measures how space is actually used, while space management software governs how space is planned and allocated. The two categories overlap, many platforms handle both, but they answer different questions. Utilization is descriptive; management is prescriptive.
"The shift from annual space audits to continuous occupancy monitoring is the single most impactful change a corporate real estate team can make. Organizations that act on real-time data consistently outperform those relying on periodic snapshots." — Dr. Sara Bayram, Workplace Strategy Researcher, Cornell University
Consider a 500-person headquarters that deploys occupancy sensors across its office floors. The data reveals that 60% of desks sit empty every Monday and Friday. Armed with that finding, the real estate team consolidates two underused floors, cutting annual lease cost by $800,000, a decision that would have been impossible to make confidently from a manual headcount alone.
Platforms like Upflex take this further by pairing occupancy data with AI-powered attendance forecasting, predicting which days teams will actually show up before the week begins, so space decisions are based on forward-looking patterns, not just historical averages.
These platforms deliver measurable cost cuts and operational gains by turning raw occupancy data into decisions your real estate team can act on immediately.
Buyers should expect six core capabilities from any credible platform:
The financial case is well-documented. JLL and CBRE research consistently shows average office utilization sitting at 40–60% before any optimization effort. Organizations that act on utilization data report 30–40% reductions in real estate costs, a figure that compounds quickly across multi-site portfolios where every underused floor carries a fixed lease obligation. For a broader comparison of leading tools, People Managing People's roundup of the best office space management software offers a useful independent reference point.
One of the fastest wins is eliminating ghost bookings, meeting rooms reserved but never occupied. Recovering that wasted capacity returns 15–25% of meeting room availability without adding a single square foot of space. Automated alerts that flag no-shows and release rooms in real time are what make that recovery possible at scale.
Attendance forecasting adds another layer of precision. Platforms that integrate AI-driven forecasting, Upflex's UnifyAI engine predicts office attendance with 97% accuracy, let facilities teams size space for actual hybrid attendance patterns rather than worst-case headcount assumptions. That shift alone can justify a significant reduction in leased square footage at the next renewal cycle.
"Eliminating ghost bookings and acting on real occupancy data can return 15–25% of meeting room capacity to an organization within weeks — without a single square foot of new construction." — Michael Creighton, Director of Workplace Innovation, MRI Software
Occupancy analytics tools serve industries well beyond the corporate office. Healthcare facilities track exam room and procedure suite utilization under HIPAA-compliant data handling to reduce patient wait times and avoid unnecessary capital expansion. Universities apply the same logic to classroom scheduling, cutting per-student space costs by identifying chronically underbooked lecture halls and redistributing assignments. Manufacturing plants monitor floor space efficiency against production throughput, measuring whether square footage allocated to a process line is earning its keep relative to output volume.
Each of these applications shares the same underlying mechanism: replacing assumption-based space allocation with data that reflects how people actually use physical environments.
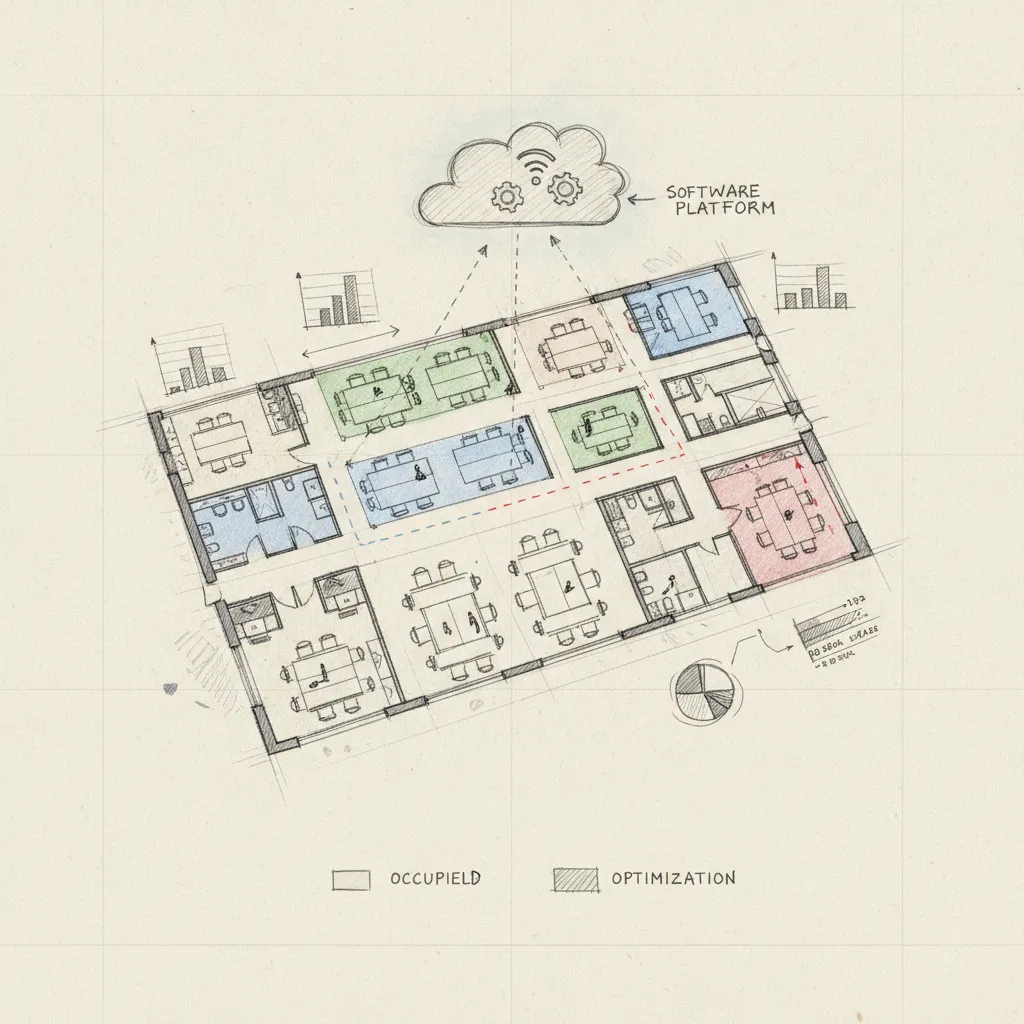
Evaluate vendors on five criteria, run a 4–6 week pilot, and define your baseline utilization target before signing, that sequence protects your budget and your timeline.
Start with sensor architecture. Agentless solutions, those that infer occupancy from Wi-Fi, badge data, or calendar signals, deploy faster and cost less than physical sensor installs. If a vendor requires proprietary hardware with no open API, walk away: you'll be locked into their upgrade cycle indefinitely.
Check integration depth next. Your chosen platform needs to connect cleanly with your existing HRIS, calendar system (Microsoft 365 or Google Workspace), and building management system. Shallow integrations mean manual data reconciliation, which defeats the purpose of buying software.
Three non-negotiables on compliance and security: GDPR certification, SOC 2 Type II attestation, and HIPAA readiness where health-adjacent occupancy data is involved. Also confirm role-based access controls exist, sensitive occupancy data should not be visible to every administrator by default.
Two additional red flags: any vendor who cannot demonstrate sub-5-minute data latency, and any platform with reporting locked to fixed templates. Flexible reporting, custom date ranges, floor-level drill-downs, exportable datasets, is what turns raw occupancy data into a real estate portfolio decision.
Before signing, define a measurable pilot metric. For example: lift average desk utilization from 45% to 70% within 90 days. Build that target into the contract so ROI measurement starts on day one, not after renewal discussions begin. Upflex's UnifyAI engine, which forecasts attendance with 97% accuracy, gives teams a concrete baseline to measure against from the first week of deployment.
Total cost of ownership matters too. Add hardware costs, IT integration hours, and ongoing sensor maintenance to the SaaS subscription fee before comparing vendors side by side. MRI Software's space management platform is one example of an enterprise-grade solution worth benchmarking during vendor evaluation.
Enterprise deployments of space utilization software typically run 3–6 months across three phases.
Change management is where most deployments stall. Before sensors go live, communicate clearly to employees what occupancy data is collected and, critically, what it is not used for. Individual surveillance is the fear; address it directly in writing.
Appoint a workplace data steward responsible for access governance and employee queries. Publish a data retention policy before go-live, not after the first complaint arrives. These steps build the trust that makes employees engage honestly with desk booking systems rather than gaming them.
Most organizations recover their investment within 12–18 months, with annual savings that routinely exceed the software cost by 5–7x.
Pricing follows three main models. Per-seat SaaS subscriptions typically run $3–$15 per seat per month. Sensor-based deployments add hardware costs on top of a software license. Large enterprises often negotiate a flat annual fee. Most mid-market deployments land between $50,000 and $200,000 annually, all-in.
The ROI formula is straightforward:
(Annual real estate cost reduction + productivity gains from reduced space friction) − (software license + hardware + implementation cost) ÷ total investment
Here is a worked example. A 1,000-person company pays $80 per sq ft for 50,000 sq ft. Utilization data identifies 20% surplus space. The company exits one 10,000 sq ft floor, saving $800,000 per year. Against a $120,000 software investment, that is a 6.7-month payback period.
Rent is only part of the return. Cutting underused areas also reduces cleaning and facilities maintenance costs, typically 8–12% of facilities operating expenditure. Utilization data also prevents unnecessary capital expenditure on new space that the numbers prove you do not need.
A 30–40% reduction in real estate portfolio size is achievable within 24 months when utilization data directly informs lease renewal and consolidation decisions. Upflex customers have documented outcomes at that level, with the platform's AI-driven insights feeding directly into portfolio decisions at renewal points, the moment when data has the most financial use.
The key condition is that utilization data must connect to decision-making workflows, not sit in a dashboard no one opens. Organizations that tie space data to lease calendars and finance reviews consistently outperform those that treat it as a reporting tool alone.
These platforms connect to your calendar, HRIS, BMS, and ERP systems via REST APIs, cutting deployment from 12 weeks to 3–4 weeks with native connectors.
The four integration categories that matter most for enterprise deployment are calendar platforms, HRIS systems, building management systems (BMS), and ERP tools. Microsoft 365 and Google Workspace sync desk bookings directly with employee calendars, so reservations appear alongside meetings without a separate login. HRIS platforms like Workday and SAP SuccessFactors feed headcount and team structure data into the platform, letting it allocate space by department rather than by guesswork.
ERP integration routes actual occupancy data into facilities cost allocation, giving finance teams a clean line from square footage to budget line item. BMS integration goes further: when real occupancy signals flow to HVAC and lighting controls, energy costs in underused zones drop 15–20%, a secondary ROI stream that strengthens the business case beyond real estate savings alone.
On architecture, REST API and webhook support are the baseline requirement. Pre-built connectors to the top five HRIS and calendar platforms eliminate custom development work and compress implementation timelines from roughly 12 weeks down to 3–4 weeks. Upflex, for example, is built to connect with Microsoft 365 and Google Workspace out of the box, so attendance forecasting and desk booking sync without bespoke engineering.
GDPR requires a lawful basis for processing occupancy data tied to identifiable individuals, and mandates data minimization, which is why compliant platforms aggregate at the zone level rather than logging named individuals' movements. In healthcare settings, HIPAA applies wherever space data intersects with patient flow, adding a second compliance layer your procurement team must verify before signing.
The following security standards are non-negotiable for enterprise buyers:
Require a documented data retention and deletion policy as well, without one, you carry liability for data you no longer need and cannot easily purge.
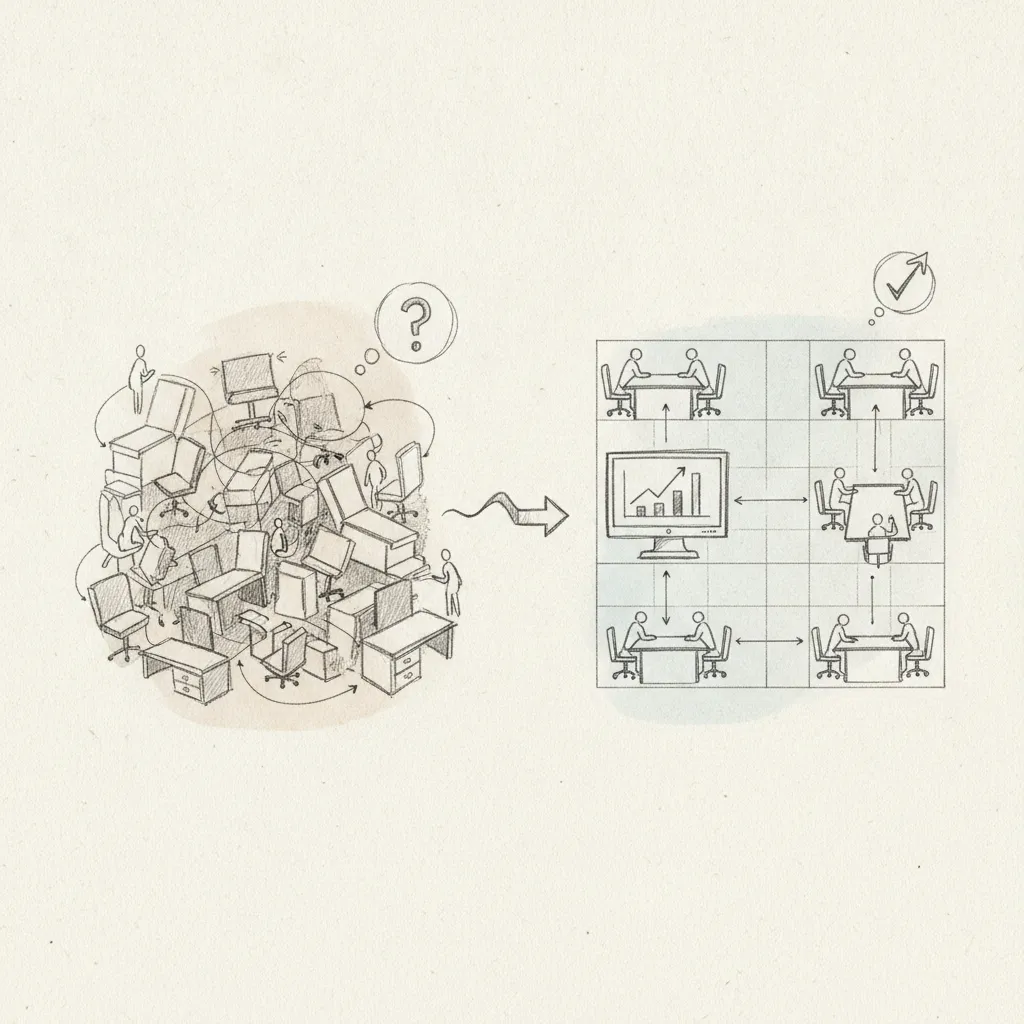
Most platforms collect occupancy data through a combination of passive infrared (PIR) motion sensors, desk-level pressure sensors, Wi-Fi and Bluetooth signal tracking, badge reader integrations, and overhead people-counting cameras. Each method has trade-offs: PIR sensors detect motion but miss stationary occupants; camera-based systems are more accurate but carry higher installation costs. Many enterprise deployments layer two or more sensor types to cross-validate readings and reduce blind spots in the data.
Most platforms report aggregated occupancy data rather than tracking named individuals, though desk booking systems do associate reservations with specific employees by design. The privacy boundary matters: GDPR in Europe and equivalent state-level laws in the US restrict continuous individual location tracking without explicit consent. Organizations should review vendor data retention policies before deployment, confirm that sensor data is anonymized at the point of collection, and communicate clearly with employees about what is and is not being recorded.
Most organizations see actionable occupancy data within the first 30 days of deployment, once sensors are calibrated and baseline patterns are established. Meaningful decisions, such as consolidating floors or renegotiating leases, typically follow after 60 to 90 days of trend data. Platforms with AI-based forecasting, like Upflex's UnifyAI engine, can accelerate this timeline by generating attendance predictions from scheduling inputs before sensor data fully matures.
Space utilization software serves both segments, but the right fit depends on portfolio complexity. Small businesses with a single office and fewer than 50 desks often get sufficient value from lightweight desk booking tools with basic occupancy dashboards. Enterprise organizations managing multi-site portfolios, hybrid attendance targets, and real estate cost pressure need platforms with AI forecasting, sensor integrations, and portfolio-level reporting, the category where tools like Upflex are purpose-built to operate.
Most workplace strategists recommend targeting an average desk utilization rate of 70–80% for a well-optimized hybrid office. Rates consistently below 50% signal significant surplus space and a strong case for consolidation. Rates above 85% can indicate overcrowding and may negatively affect employee experience. The right target depends on your hybrid schedule, team density goals, and lease flexibility — utilization data gives you the evidence to set and defend that number with finance and leadership.
Space utilization software moves real estate decisions from gut feel to verified data, and the gap between those two approaches now shows up directly on the balance sheet. Three things are worth acting on: first, audit your current occupancy measurement method and identify whether you have sensor-level data or are relying on badge reads alone; second, establish a utilization baseline before your next lease event so you negotiate from evidence, not estimates; third, evaluate whether your platform forecasts attendance or only records it after the fact, that distinction determines whether you can act proactively or only react.
If attendance forecasting is a gap in your current stack, request an Upflex demo and ask specifically to see UnifyAI's 97% accuracy benchmark applied to a scenario matching your office headcount and hybrid schedule.
Explore more from our content library: