Share This Article
No items found.


Office utilization metrics measure how much of your office space employees actually use against how much you pay for, tracking occupancy rate, utilization rate, and cost per seat to find the gap between capacity and real demand. Hybrid work makes that gap expensive: a company paying for 500 desks but averaging far fewer daily check-ins is funding empty square footage. Tracking these numbers turns real estate decisions, consolidating floors, renegotiating leases, redesigning layouts, from guesswork into evidence.
Office utilization metrics track which desks, rooms, and floors get used, when, and how often, they describe space behavior, not individual output. These numbers answer a narrow question: is this square footage earning its cost, or sitting idle while the lease payment clears every month.
That narrowness matters. A desk booking log or badge-swipe record tells you a floor hit 40% occupancy on a Wednesday. It tells you nothing about what any one person accomplished that day, and it isn't built to. Office utilization metrics stay at the level of the room and the seat, not the employee.
Space utilization measures square footage and seats; productivity tracking measures people, and mixing the two breaks trust fast. Keyboard-monitoring software, login timestamps, and activity trackers belong to a different category of tool entirely, and workplace teams that blur the line tend to face pushback from employees who read "we're counting desks" as "we're counting you" [4].
The distinction has a practical payoff. Utilization data can justify closing a floor or renegotiating a lease without touching a single performance review. Keeping the two data sets separate also keeps the rollout politically simpler, workplace and HR leaders can present occupancy dashboards as a real estate exercise, not a surveillance program.
Hybrid schedules spread headcount across the week unevenly, so a lease sized for every employee at once sits mostly empty on most days, driving up the real cost per person who actually shows up. A company with 500 badge holders rarely has 500 people on-site at once under a hybrid policy, attendance clusters on certain days and thins out on others [3][5]. The lease, though, is still priced for peak capacity.
That mismatch is what makes tracking non-optional for hybrid employers specifically. A fully in-office company can estimate space need from headcount alone. A hybrid one can't, the gap between seats paid for and seats used only shows up in the data, which is why finance and workplace teams both depend on it: finance needs it to model lease renewals and consolidation scenarios, and workplace teams need it to decide which floors to redesign, which to vacate, and where density is causing real friction on peak days [4][5]. Platforms like Upflex pair this usage data with AI-driven attendance forecasting, so real estate decisions are built on where teams are actually headed, not last quarter's badge counts.
Five numbers drive most real estate decisions: occupancy rate, utilization rate, capacity, cost per seat, and cost per person, and each points to a different lever for cutting spend.
Tracked in isolation, any one of these metrics can mislead you. Tracked together, they tell you whether you're paying for too much space, the wrong kind of space, or space that's simply scheduled badly.
Occupancy rate, utilization rate, and capacity measure three different things, and confusing them is the single most common reason companies sign the wrong-sized lease.
Capacity is the maximum number of people a space was designed to hold, the desk count, the fire-code limit, the number printed on the floor plan. Occupancy rate is a snapshot: how many of those seats are filled right now, or at a specific hour, compared to total seats available [5]. Utilization rate is the pattern over time, how often a space actually gets used across days, weeks, or quarters, not just at one moment [2].
A floor can show 90% occupancy at 10 a.m. on a Tuesday and still have a 20% utilization rate for the month, because Monday and Friday sit nearly empty. If you size a lease off a single high-occupancy snapshot, you'll pay for capacity that goes unused four days out of five. If you size it off utilization alone without checking peak occupancy, you'll run out of desks on your busiest day. Real estate teams that conflate the two tend to either overbuild for the rare full house or underbuild and create a scramble for seats on peak days [4].
Cost per seat and cost per person expose the real price of underused space, even when your rent per square foot looks competitive on paper.
Cost per seat divides total real estate spend, rent, utilities, services, by the number of seats you lease or own. Cost per person divides that same spend by actual headcount using the space. When utilization is low, cost per seat stays flat on the spreadsheet, but the true cost per person who actually shows up climbs, because fewer people are absorbing the same fixed bill [3]. A lease that looks efficient at the square-foot level can still be a poor investment once you factor in how rarely the seats are filled.
This is where office space utilization rate becomes a targeting tool rather than a reporting metric. Run it floor by floor or wing by wing, and the underperforming zones stand out immediately, the ones worth consolidating, subleasing, or converting to shared or collaborative space [1]. Combined, these office utilization metrics tell you whether the real problem is excess square footage, a layout mismatched to how teams actually work, or scheduling patterns that cluster everyone into two days a week. Upflex's UnifyAI engine forecasts attendance with 97% accuracy and feeds that data into desk booking and portfolio decisions, so real estate teams can act on patterns instead of guesses, a mechanism tied to the 40%+ real estate savings some organizations have documented.

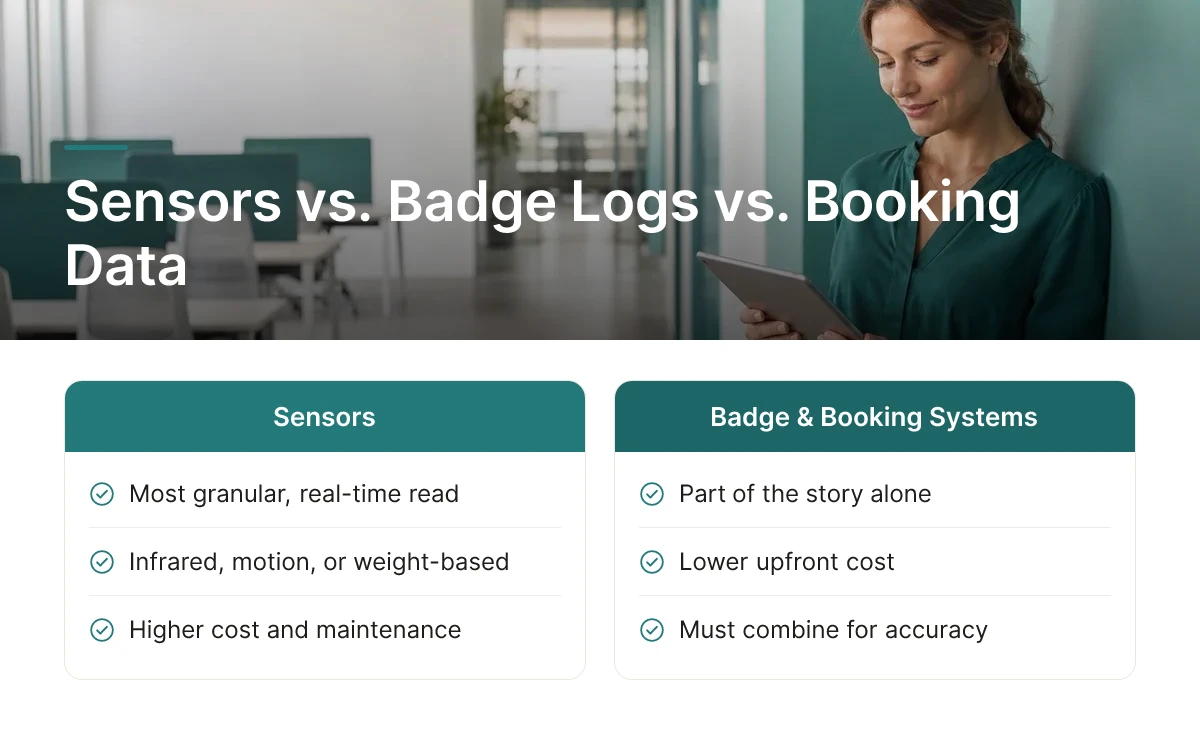
Accurate office utilization metrics come from combining three data sources, sensors, badge access logs, and booking platforms, because each one alone tells only part of the story.
Occupancy sensors, infrared, motion, or weight-based devices mounted under desks or on ceilings, give the most granular, real-time read on whether a seat is actually occupied [1]. The trade-off is cost: sensor hardware requires installation, wiring or battery maintenance, and ongoing calibration across every floor you want to measure.
Access control and badge data sit at the opposite end. You already have it, since most enterprises use badge readers for building security, so it costs nothing extra to pull. But badge swipes only confirm someone entered the building, not that they used a desk, sat in a meeting room, or stayed past lunch [4].
Desk booking platforms are the cheapest layer to analyze because the data is a byproduct of your existing reservation system. The catch is that bookings reflect intent, not behavior. An employee can reserve a desk Monday morning and work from home anyway, and a booking system has no way to flag that no-show unless something else confirms actual presence [4].
Pairing booking records with a check-in step or sensor confirmation closes that gap. Upflex's UnifyAI engine takes this approach, cross-referencing scheduling inputs against workplace usage data to forecast attendance with 97% accuracy, rather than relying on reservation counts alone. Reconciling booked-versus-attended numbers this way is what turns a reservation log into a utilization rate you can trust for real estate decisions.
Open desk areas call for density and headcount counts, how many people occupy a zone against its designed capacity over a given period [5]. Meeting rooms need a different lens entirely: turnover rate and duration of use matter more than headcount, since a room booked for eight but used by three for fifteen minutes still counts as "occupied" in a crude binary measure [2].
Dedicated desks introduce a third variant, the gap between assignment and attendance. A desk can be permanently assigned to one employee yet sit empty four days a week, which badge or sensor data will reveal but an assignment list never will [3].
The remaining challenge is integration. Headcount lives in HR systems, entry data lives in badge systems, and reservations live in booking tools, three systems that rarely talk to each other without someone manually reconciling them into a single view real estate and finance leaders can act on.
There is no universal target because a fully remote-friendly tech team, a client-facing finance office, and a manufacturing admin floor have structurally different attendance patterns and space needs.
A benchmark borrowed from a different industry or work style tells you almost nothing about whether your own space is right-sized. The more useful exercise is building a target from your own policies, your own headcount patterns, and your own peak days, then tracking office utilization metrics against that baseline over time rather than against an external number someone else published.
A software company with a flexible, choose-your-own-days policy will rarely see consistent mid-week peaks, because engineers and product teams often cluster their focus work at home and save the office for specific collaboration sessions. A client-facing finance or professional services office, by contrast, tends to run hotter on weekdays because client meetings and in-person reviews pull people in regardless of personal preference. A manufacturing company's admin floor sits somewhere in between, shaped by shift schedules and plant proximity rather than hybrid policy at all.
Company size matters too. A 200-person company can get away with looser forecasting because leadership can informally track who is coming in. A 5,000-person enterprise spread across a dozen offices cannot, it needs systematic data to see the same picture [4]. Work-style policy is the other lever: a mandated three-day-in-office rule compresses attendance into predictable peaks, while a fully flexible policy spreads it more thinly and unevenly across the week, which usually calls for a different space footprint and a different definition of "healthy" use.
Three broad patterns tend to show up in the data:
Rather than chasing a fixed percentage, track the trend: is utilization rising, falling, or holding steady after a policy change or a floor consolidation? A rising trend after you shrink the footprint confirms you cut the right amount; a falling trend after a mandate suggests the policy isn't landing. Upflex's attendance forecasting is built around this problem, predicting attendance with 97% accuracy so real estate teams can set targets based on where usage is actually heading, not where it stood last quarter.
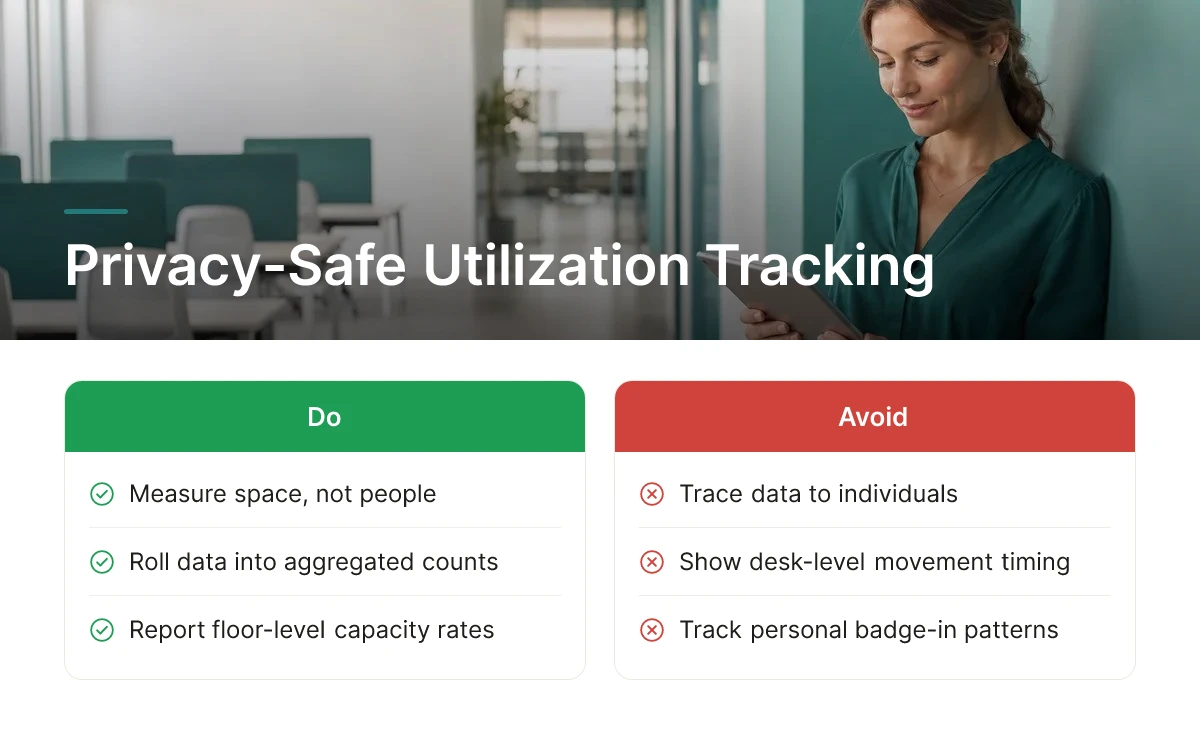
Office utilization metrics stay legally safe and employee-friendly when they measure space, not people, the moment data can be traced to an individual's movements, trust erodes and legal exposure rises.
Employees generally tolerate knowing that a floor ran at 62% capacity on Tuesday. They react very differently to a system that can show their manager exactly when they badged in, which desk they sat at, and how long they were away from it.
The distinction is aggregation. A sensor count or badge sweep that gets rolled up into a floor-level or building-level number tells facilities teams what they need, total occupancy, peak hours, room turnover, without identifying who was where. The same raw feed, left unaggregated, becomes a movement log. That's where surveillance concerns start, and where workplace teams lose the benefit of the doubt even if monitoring individuals was never the intent.
Communicating what's actually being measured, space usage patterns, not personal schedules, defuses most of this tension before it starts. Employees who understand that a sensor counts bodies in a room, not identities, tend not to object to the practice itself.
Three practical steps reduce risk regardless of jurisdiction:
In the EU, GDPR treats badge and sensor data as personal data when it can be linked to an identifiable employee, which constrains how long it can be retained and who can access it. Works councils in several European countries have formal consultation rights over any system that monitors employee behavior, meaning a desk-sensor rollout can stall for months without early legal and HR involvement. U.S. requirements vary by state, but the operating principle is the same: involve legal and HR before sensors or access-control systems go in, not after.
Law sets the floor, not the ceiling. Internal workplace policy should define retention windows, specify who can see individual-level data versus aggregate reporting, and state explicitly that utilization tracking exists to inform space decisions, not to evaluate individual attendance. Upflex's forecasting and booking data, for example, is built to support portfolio-level decisions like consolidation and co-attendance planning, which keeps the focus on space performance rather than individual oversight.
No, utilization metrics complement headcount planning but can't replace it. Headcount planning answers how many people you're budgeted to employ; utilization data answers how many of them actually show up and where. Real estate decisions need both: a seat count based on headcount alone ignores the 30–50% average attendance gap most hybrid offices see, while utilization data alone can't tell you where the organization is heading next quarter.
Re-measure at least quarterly, with a focused check-in 60–90 days after any layout or lease change. Attendance patterns shift as teams adjust to new policies, seasons change, and new hires onboard, so a single post-change snapshot can mislead you. Continuous tracking catches drift before it turns into another costly resizing decision.
They work for both, though the value differs. Fully in-office teams use utilization data mainly to fine-tune density, meeting room allocation, and seat-to-employee ratios, while hybrid teams rely on it to answer the harder question: who's actually coming in, and when, before deciding how much space to keep at all.
Start with badge-swipe data and calendar or desk-booking logs you likely already have, no new hardware required. Cross-reference entry logs against booking records to spot no-shows and ghost bookings, which typically inflate perceived demand. This gives a directional read within a few weeks, enough to guide early decisions before investing in sensor-based or AI-forecasting tools like Upflex for more precise, forward-looking attendance predictions.
Ownership usually sits jointly between workplace or facilities teams and finance, since one group manages the physical space and the other models the cost impact. HR typically joins for policy questions and privacy oversight, while IT supports the underlying sensor, badge, or booking systems. Spreading ownership this way keeps the data tied to real decisions instead of becoming a report nobody acts on.
Office utilization metrics only pay off when they drive a decision, a lease renegotiation, a floor consolidation, or a shift in which days teams are expected on-site. Start with the basics (occupancy rate, peak occupancy, space utilization rate), make sure badge data and booking data agree with each other, and re-measure after every change rather than assuming the fix holds.
The organizations cutting real estate spend by 40% or more aren't just measuring harder, they're forecasting ahead of attendance instead of reacting to it, which is the gap platforms like Upflex are built to close with 97% accuracy attendance predictions. As a next step, pull your last 90 days of badge and booking data and compare them side by side, the gap between the two numbers is usually where your savings are hiding.
Explore more from our content library: