Share This Article
No items found.


Space utilization analytics turns lease savings into a repeatable process: you measure how much of your office is actually used, compare that against what you're paying for, then cut or restructure the space nobody needs. Companies that track occupancy and utilization over several weeks typically find they're paying for far more space than they use at peak times, that gap is exactly what you renegotiate, sublease, or consolidate out of your real estate portfolio at your next lease event.
Before you can run space utilization analytics, you need four data inputs in hand: badge or entry data, sensor or sign-in records, floor plan square footage, and your current lease terms.
Each input answers a different question, and skipping one leaves a gap in the analysis. Badge and entry data tell you who came into the building and when. Sensor data or desk sign-ins tell you which seats, rooms, or floors people actually occupied once inside. Floor plan square footage gives you the denominator, how much space exists to measure usage against. Lease terms give you the business context: expiration dates, renewal notice windows, and your cost per square foot by floor or zone. Without that last piece, you can have perfect occupancy data and still miss the decision point that makes it actionable, the lease event where you can actually downsize or renegotiate.
Collect this data across at least a few weeks that include both normal and peak days. A single Tuesday snapshot tells you almost nothing, weekly patterns swing widely, with midweek days often running far higher than Mondays or Fridays [5]. Pulling data only from a slow week will understate how much space you need; pulling only from a peak week will overstate it. You need both to find the real average and the real ceiling.
No, occupancy counts how many people are present, while utilization measures how much of your available capacity those people actually used, and confusing the two leads to bad lease math. A floor with 200 badge swipes a day might sound busy, but if that floor has 400 desks and people cluster in the same 100 seats, utilization is far lower than occupancy suggests. Relying on occupancy alone, or on booking data, which overstates real usage because of no-shows and ghost bookings [5], tells you a space looks full without telling you whether the square footage is earning its cost. Lease decisions should follow utilization, not foot traffic.
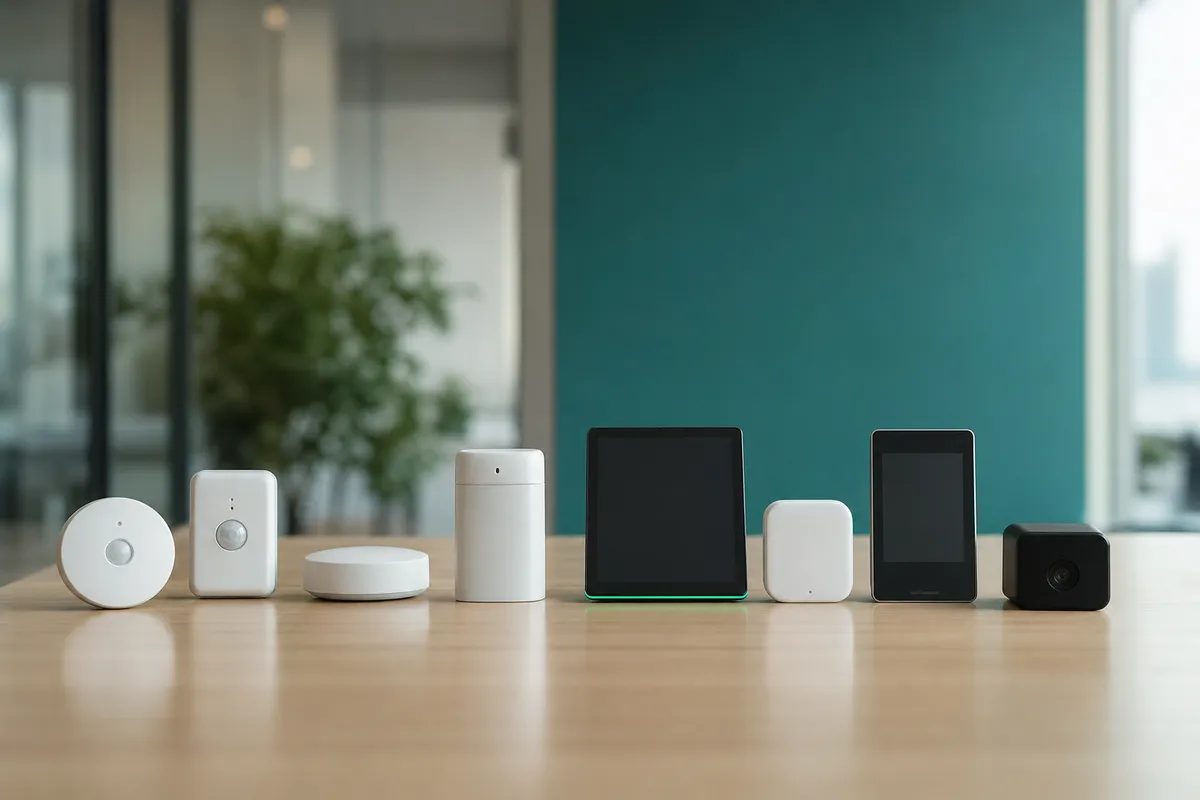
No single sensor or platform is mandatory to get this right. Badge readers, Wi-Fi triangulation, desk sensors, or simple sign-in sheets can all work. What matters is consistency: the same measurement method, applied to every floor and every room type, over the same time window, so the comparisons between buildings and the trend lines over time actually mean something when you bring them to a lease negotiation.
Three numbers tell you almost everything about how your office is performing: peak utilization rate, average utilization rate, and seat-to-employee ratio. Together they expose the gap between the space you lease and the space your teams actually need.
Peak utilization rate measures the highest occupancy your office hits during a given period, usually the busiest hour of your busiest day. Average utilization rate measures occupancy across all hours and days in a reporting window, smoothing out the peaks and valleys. Seat-to-employee ratio compares the number of assigned or bookable seats against headcount, flagging whether you're carrying more capacity than your workforce requires.
Each metric is calculated the same basic way: actual usage divided by available capacity. The calculation only becomes useful when you run it at the right level of detail, by room type (desks, conference rooms, phone booths) and by floor, not just for the building as a whole. A 55% average utilization rate at the building level can mask a floor running at 85% and another sitting at 25% [5]. Without that granularity, you can't tell which floor to cut and which to keep.
Seat assignment analytics flag which assigned desks go unused, and that gap is where leased capacity quietly becomes a sunk cost. If a department has 200 assigned seats but sensor or badge data shows only 110 occupied on a typical day, you're paying for 90 seats of capacity nobody is using [2]. Connecting seat assignments to real occupancy data turns that abstract waste into a concrete number finance can act on, whether that means reassigning seats, consolidating a floor, or renegotiating a lease at renewal.
Time-of-day and day-of-week patterns matter just as much as the raw numbers. Office attendance typically concentrates midweek, with Tuesday through Thursday running far above Monday and Friday levels [5]. That pattern reveals how much space you only need for three days, which is a different real estate question than how much space you need every day.
This is also why averaging occupancy over a full month can mislead the people sizing your lease. A monthly average flattens Tuesday's crunch and Friday's near-empty floor into one unremarkable figure, hiding the true peak demand your space actually has to accommodate. Lease sizing decisions should be based on peak utilization, not the average, otherwise you risk cutting capacity you need on your busiest days to chase savings that don't reflect real demand. Platforms built for space utilization analytics, including Upflex's office orchestration dashboard, track these patterns automatically across booking, forecasting, and occupancy data so real estate teams aren't reconstructing peak-day demand from spreadsheets.

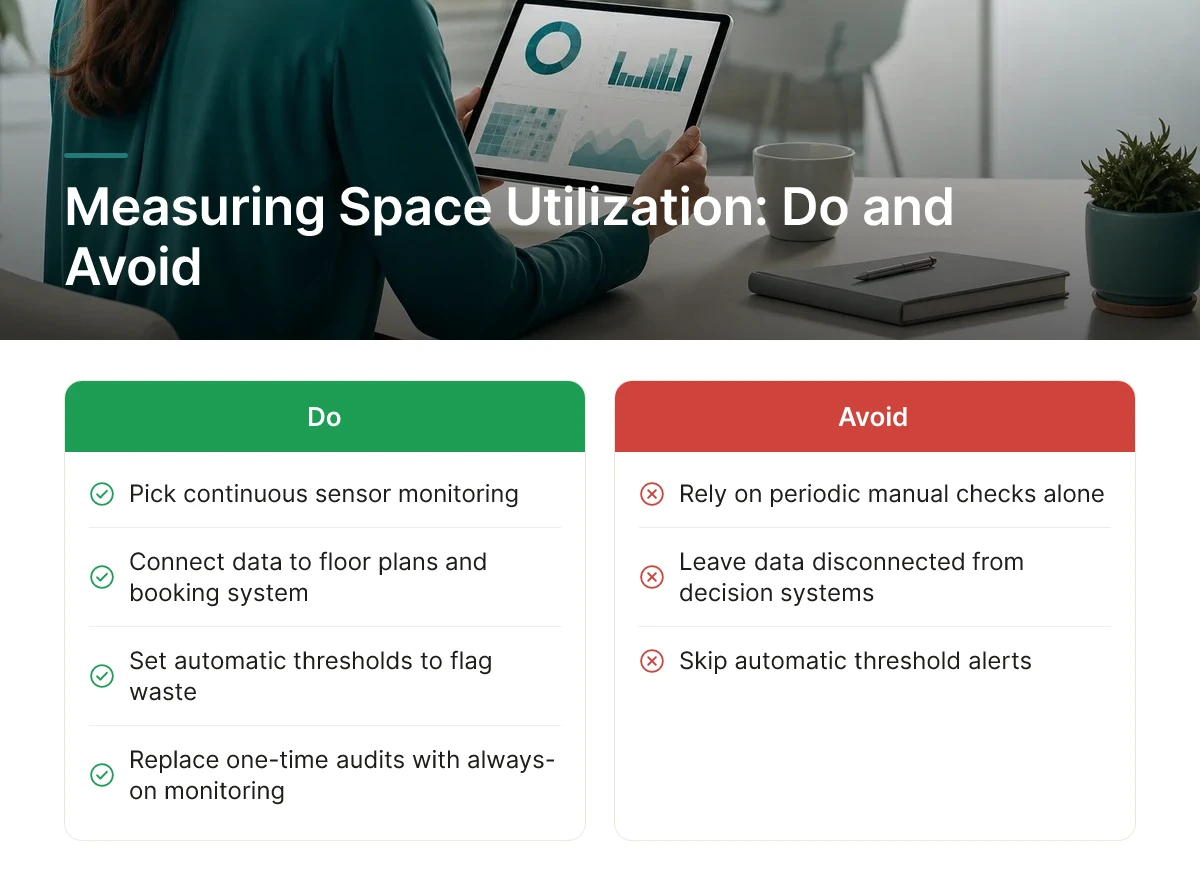
Pick continuous sensor monitoring over periodic manual checks, connect the data to your floor plans and booking system, and set automatic thresholds to flag waste.
Space utilization analytics only works if the underlying data is current, granular, and connected to the systems where decisions actually get made. That means choosing the right collection method, replacing one-time audits with always-on monitoring, and routing the output somewhere people can act on it. For more information, see Retail Analytics Key Metrics That Matter.
No single data source gives you a complete, accurate picture, each method trades off coverage against precision, so most organizations combine two or more.
Booking data deserves a caveat here too: reservation systems alone tend to overstate usage because no-shows and ghost bookings go uncorrected unless paired with a check-in or sensor confirmation [5].
Set a minimum utilization threshold for each zone or floor and let the system flag anything that falls below it automatically, rather than waiting for someone to notice in a quarterly report.
Continuous monitoring is what makes this possible. A single walkthrough or employee survey captures a snapshot, and snapshots miss the swing between a packed Wednesday and a near-empty Friday, a gap that's often the single biggest driver of wasted square footage [5]. Monitoring every day, automatically, replaces guesswork with a running record you can trust when a lease renewal comes up. Raw occupancy counts are only half the job. That data needs to connect to your digital floor plans and your desk or room booking system, not sit in a spreadsheet nobody opens. When utilization numbers are tied to specific zones on a live floor plan, a facilities lead can see at a glance which wing of a building is running at 20% capacity and act on it, rather than cross-referencing three separate reports. Privacy matters at this stage. Aggregate, anonymized counts, "14 of 40 desks occupied on floor 3" rather than tracking named individuals, answer the lease-sizing question without triggering the consent and monitoring concerns that come with individual-level tracking. Most employees will accept sensors and badge analysis when they understand the output is a headcount by zone, not a log of their personal movements. This is the layer where Upflex fits into the stack: its office orchestration dashboard pulls occupancy signals together with desk booking and attendance forecasting from UnifyAI, so utilization data for an underused floor shows up next to the booking tools that can actually fix it, rather than in an isolated analytics report.
Subtract your average peak utilization rate from 100%, apply that gap to your total square footage, and the result is your negotiation baseline for the next lease conversation. If a 150,000-square-foot office peaks at 55% utilization even on its busiest Tuesday, roughly 67,500 square feet is sitting idle on your best day, and every day that isn't Tuesday, the number is worse. That gap is what you bring to the landlord, the broker, or the CFO.
Space utilization analytics only earns its value once the gap becomes an action. There are four main levers, usually combined rather than used in isolation:
Overlay utilization data directly onto a digital floor plan so facilities and finance teams can point at specific zones, not abstract percentages, when deciding what to cut [2]. Color-coding by occupancy rate makes chronically empty neighborhoods obvious at a glance, which turns a spreadsheet argument into a floor-by-floor conversation the whole team can agree on before anyone calls the landlord or broker.
Treat this as a standing practice rather than a pre-renewal scramble. Utilization patterns shift as headcount, hybrid policy, and team structures change, so a real estate strategy built on one-time analysis goes stale fast, continuous tracking keeps the next lease decision ready before the deadline forces it.
Five mistakes turn sound space utilization analytics into bad real estate decisions: short data windows, conflating occupancy with utilization, ignoring lease timelines, skipping employee communication, and treating measurement as a one-time project.
Each one is avoidable. None of them are rare.
Pulling utilization data from a holiday week, a slow August, or the week half your team was at an offsite produces a number that flatters your cost-cutting case but doesn't reflect reality. Weekly patterns vary sharply even in a normal month, office usage can swing from near-empty on Mondays and Fridays to near-capacity midweek [5]. A lease decision built on four weeks instead of a full quarter risks giving back space you actually need by October.
Occupancy tells you how many badges swiped in; utilization tells you whether the desks, rooms, and square footage people touched were used efficiently. Presenting one as the other to the CFO is how portfolio decisions go wrong in both directions, cutting too much space because raw attendance looked low, or protecting space that's badly laid out but technically "occupied." Keep the two metrics separate in every report finance sees.
Utilization data is only actionable if it lands before a notice period or renewal deadline. Running the analysis six months after a landlord notice window closed means sitting on a solid business case with nowhere to use it. Map your analytics cadence to actual lease dates, not just to a quarterly reporting rhythm.
Rolling out sensors, badge tracking, or desk booking data without explaining why creates suspicion that stalls adoption, and bad adoption produces bad data. Tell employees what's being measured and why before you measure it.
Hybrid attendance patterns shift as teams reorganize, policies change, or new hires join. A single audit captures a moment, not a trend. Upflex addresses this by pairing UnifyAI attendance forecasting, which predicts office attendance with 97% accuracy, with ongoing desk booking data, so underutilization gets flagged as it emerges, not a year later when the lease is already signed.

Organizations that act on utilization data typically cut real estate costs by 30-50% [5], often generating thousands of dollars in savings per desk annually. The exact return depends on your starting utilization rate and lease flexibility. A portfolio running at 31% utilization [3] has far more room to consolidate than one already near 70%. Upflex customers combine this data with UnifyAI forecasting to document 40%+ reductions in real estate spend while maintaining co-attendance targets.
Companies bring floor-by-floor occupancy data to lease renewal talks to justify downsizing, consolidating locations, or negotiating shorter terms. Instead of guessing, finance and real estate leaders show landlords and internal stakeholders actual utilization rates, often well below the 64% pre-pandemic global average [3], as evidence. This turns a subjective "we think we need less space" argument into a data-backed negotiating position, supporting decisions to exit underperforming leases or right-size renewals before signing.
The core metrics are utilization rate (occupancy divided by capacity), peak versus average occupancy, no-show rate, and booking-to-check-in ratio. Weekly patterns matter too, midweek days often hit 85-95% capacity while Mondays and Fridays drop to 20-30% [5]. Tracking all four prevents misreading a single busy Tuesday as full-week demand.
Tracking utilization shows which leases carry space you no longer need, timed to renewal dates so you negotiate from data, not deadline pressure. Without it, lease decisions default to headcount assumptions that ignore actual hybrid attendance patterns. Utilization metrics help you reduce wasted space, plan for future demand, and avoid double-booking conflicts before they affect renewal terms [1].
Space utilization analytics only pays off when it changes a decision, a lease renewal, a floor consolidation, a seating policy. Start by pairing occupancy data with attendance forecasting rather than relying on booking counts alone, since bookings alone overstate usage by 20-35% [5]. Track weekly patterns, not just averages, before you act on any single week's numbers. Then bring that evidence to your next lease conversation instead of waiting for the deadline to force the decision. As a next step, pull your last 90 days of badge or sensor data and calculate utilization rate by floor, it will show you exactly where the next lease negotiation should start.
Explore more from our content library: