Share This Article
No items found.


The must-have features in a workplace analytics platform are accurate occupancy sensing, hybrid attendance forecasting, space utilization reporting, real estate cost modeling, HR/IT system integration, privacy-by-design data handling, customizable dashboards, and scenario planning tools. Together these let facilities and real estate teams see how much office space is actually used, by whom, and when, then right-size the portfolio instead of guessing. The strongest platforms separate space-usage data from individual employee monitoring, measuring desks, rooms, and floors rather than tracking people's activity.
A workplace analytics platform starts with occupancy sensing: counting how many desks, rooms, and floors are actually in use at any given time, measured continuously rather than estimated once a quarter.
Sensors, badge swipes, and Wi-Fi or network signals feed these counts at the desk, room, and floor level. None of this requires tracking which employee sat where or what they did once they logged in, the system counts presence, not identity or output. Facilities and corporate real estate teams managing multiple floors or sites get a continuous record of which space is underused and which is consistently overbooked, replacing guesswork built on complaints and spot-checks.
The design choice to look for: anonymized, aggregate-only occupancy counts built into the platform's architecture, not bolted on after a privacy review. Platforms that report "12 people on Floor 3 between 10 a.m. and noon" rather than "Employee X badged in at 9:47 a.m." keep the data useful for space decisions without creating an HR liability.
Space utilization tracking answers "is this room or desk being used," while employee monitoring software asks "what is this person doing." A workplace analytics platform in the corporate real estate sense never touches productivity, screen time, or individual performance, it measures square footage against headcount, full stop.
Attendance forecasting predicts how many people will show up on a given day before it happens, turning space and staffing planning from reactive to proactive.
The mechanism combines historical check-in patterns, desk booking data, and team schedules to project daily attendance across departments. Operations leaders coordinating hybrid schedules across multiple teams use these forecasts to decide how many floors to open, how many desks to prep, and whether a Tuesday needs extra meeting room capacity or a Friday needs none.
Most building-wide average forecasts tell you 60% occupancy is likely next Wednesday, useful, but not actionable for a manager trying to get a specific team in the room together. Upflex's UnifyAI engine forecasts at the team level with 97% accuracy, so managers can plan in-office days around actual co-attendance rather than hoping schedules overlap. That team-level granularity is the differentiator most competing platforms skip, since building-wide averages are easier to compute but far less useful for coordinating who's actually in the same room on the same day.
Portfolio optimization tools convert occupancy and attendance data into real estate decisions, consolidating floors, subleasing space, or exiting leases entirely.
Underutilization reports make the case directly: if a floor averages 25% occupancy for six consecutive months, that's a consolidation candidate, not a hunch. CRE and finance stakeholders accountable for the real estate budget use this data as a negotiating position when a lease comes up for renewal, replacing anecdote with a documented usage record a landlord or CFO can't easily dispute.
Look for scenario-modeling tools that simulate the space and cost impact of different return-to-office policies, three days versus two, team-based anchoring versus open hot-desking, before committing to a lease decision. Upflex customers have documented real estate spend reductions of 40%+ using this combination of utilization data and portfolio planning. Weigh that potential against platform investment in qualitative terms: a mid-range or enterprise-tier subscription is a small fraction of the annual lease cost for even one underused floor, which is why this category of tool tends to pay for itself quickly once a consolidation decision is made.
Dashboards need to show each stakeholder a different slice of the same data, because facilities, HR, finance, and executives don't make the same decisions.
A facilities manager needs floor-by-floor utilization heat maps. Finance wants cost-per-square-foot trends tied to lease dates. HR and workplace experience leaders care about co-attendance rates and whether teams are actually meeting in person. Executives want a one-page summary with a trend line and a recommendation. A platform that lets each role configure its own view of the same underlying dataset gets stakeholders aligned faster, since nobody is manually rebuilding someone else's report in a spreadsheet before a budget meeting.
This matters most for mid-size to large organizations with multiple decision-makers who all need visibility but don't all need the same numbers. The differentiator to check for: scheduled, automated report delivery straight to each stakeholder's inbox, rather than requiring someone to log in, filter, and export manually every month.
They determine whether data actually drives decisions or sits unused in a tool nobody opens. Real-time, role-specific dashboards are what turn a workplace analytics platform from a reporting system into something a CFO and a workplace manager both check before a meeting.
AI moves a platform past raw occupancy counts, recognizing patterns across attendance and booking data to flag anomalies and recommend specific changes automatically. For more information, see Seo Automation Platform The Complete 2026 Guide.
The mechanism works by scanning attendance, booking, and space data continuously for patterns a human reviewing spreadsheets would likely miss, a neighborhood that's consistently double-booked, a floor whose usage dropped sharply after a policy change, a meeting room size mismatch against actual group sizes. This cuts the manual analysis time facilities teams used to spend cross-referencing badge logs and booking exports by hand.
Organizations running many locations benefit most, since manual review across a dozen or more sites doesn't scale no matter how skilled the analyst. The differentiator worth checking for: automation that recommends a specific action, resize this floor, reassign that neighborhood, convert these desks to hot-desking, rather than a platform that only visualizes the numbers and leaves the interpretation to you.
AI is what separates a dashboard from a decision-support system. Automated pattern detection and recommendation engines are increasingly treated as core infrastructure for occupancy-based space planning [5], since enterprises managing multi-building portfolios can't rely on dashboards alone to catch what's changing in real time.
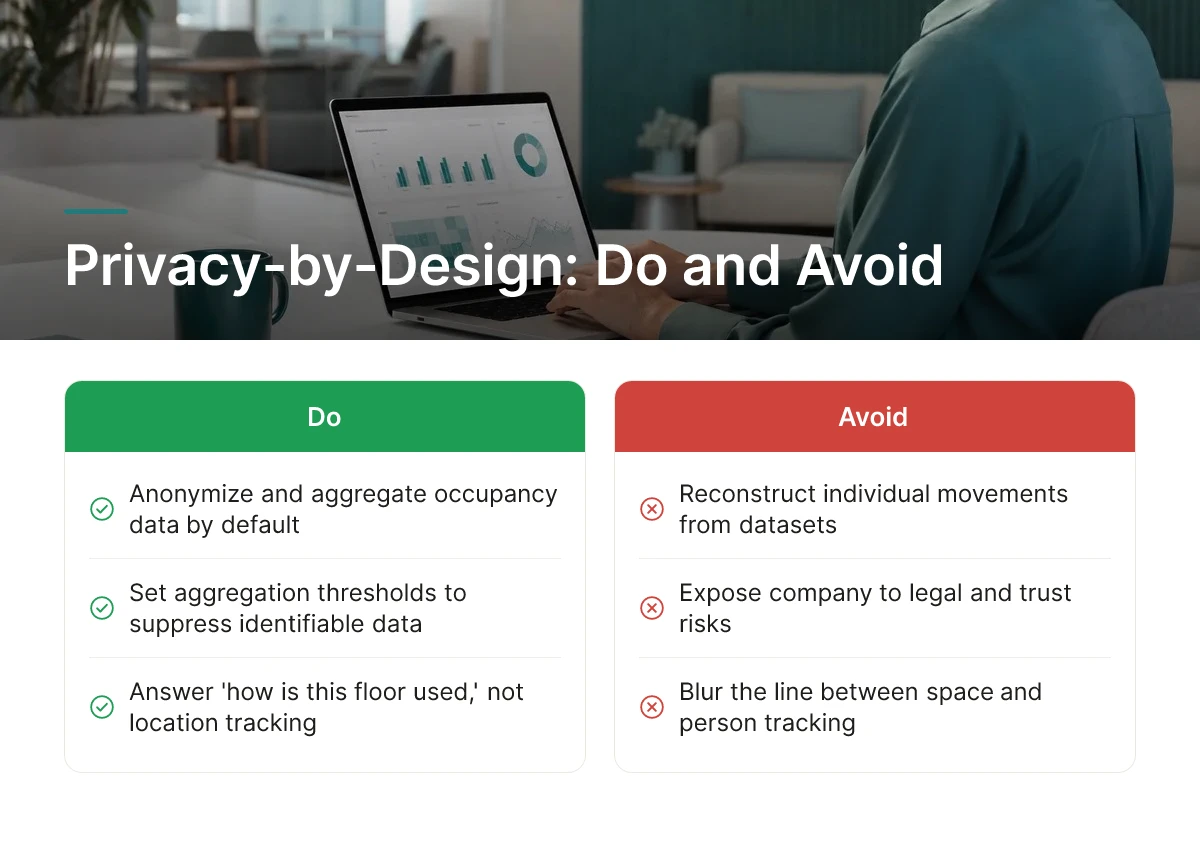
A workplace analytics platform should anonymize and aggregate occupancy data by default, so no individual's movements can be reconstructed from the dataset.
Look for aggregation thresholds, rules that suppress data when a zone's headcount drops low enough to make an individual identifiable, such as a single occupant on a floor at 7 a.m. This matters because space-focused tools are meant to answer "how is this floor used," not "where is this person right now." Platforms that blur that line expose a company to the same legal and trust risks as employee monitoring software, which collects identifiable activity data by design.
This approach lowers legal exposure and protects employee trust better than platforms built around individual tracking. It matters most for organizations in regulated industries, or those with works councils and union agreements that restrict monitoring of named employees.
The differentiator to verify before buying: granular retention controls. A credible platform lets administrators set how long raw data persists, and exclude certain data types, like badge swipes tied to named individuals, from the system entirely, rather than relying on a generic privacy policy page to cover the gap.
A workplace analytics platform earns its value by connecting HRIS, calendar, booking, and badge systems into one consistent dataset instead of five conflicting ones.
Integration points typically include the HRIS for headcount and org structure, calendar and booking tools for reservation data, and badge or access-control systems for actual entry records. Without these connections, teams end up reconciling attendance numbers across spreadsheets that never agree.
The benefit is a single source of truth: one number for utilization that real estate, HR, and finance can all cite in the same meeting. This matters most for IT and workplace teams managing a broader stack of scheduling, identity, and facilities tools that weren't built to talk to each other.
The differentiator worth checking during evaluation is whether the vendor ships pre-built connectors and open APIs, versus requiring a custom integration project that stretches deployment by months. Also confirm the infrastructure dependencies up front, sensors need reliable network access, and user provisioning typically runs through SSO, so IT should scope both before committing to a timeline.
Deployment complexity scales with site count, sensor density, and integration scope, not simply with the number of employees on the payroll.
A 50,000-employee company with three headquarters can deploy faster than a 5,000-employee company spread across 40 regional offices, because the second scenario multiplies the number of sensor installs, network configurations, and local IT handoffs. Sizing a rollout by headcount alone misses the real cost driver.
The benefit of a phased approach, piloting one floor or one site before expanding, is that it reduces risk for larger organizations making a multi-year commitment. Multi-site enterprises generally need staged rollouts with checkpoints between phases; single-site companies can often go live in a shorter window since there's one network, one badge system, and one stakeholder group to align.
The differentiator to look for is a vendor that offers a defined pilot or phased deployment model with measurable checkpoints, accuracy thresholds, adoption rates, data completeness, rather than an all-or-nothing rollout that leaves no exit point if the first site underperforms.
A workplace analytics platform should capture baseline utilization and cost data before rollout, then track changes against that baseline automatically.
The mechanism works like this: before go-live, the platform records current occupancy rates, square footage per employee, and real estate spend. After implementation, it compares those same metrics month over month, showing whether consolidation decisions or schedule changes actually moved the numbers. Without that baseline, any ROI claim is a guess dressed up as a result.
This gives finance and leadership a defensible way to justify continued investment in the platform, rather than relying on anecdotes about a quieter office on Mondays. It matters most for organizations that report outcomes to finance or the board on a recurring cycle and need numbers that hold up under scrutiny.
The differentiator is built-in before/after comparison reporting. Upflex, for example, pairs its UnifyAI attendance forecasting with real estate portfolio data to show utilization trends directly in the platform, with customers tracking outcomes like 40%+ reductions in real estate spend without exporting data into a separate BI tool to build the case.
Match the platform to your biggest pain point first, space waste, attendance forecasting, or compliance, then filter by site count and privacy needs.
Start with a short checklist: what's the primary problem (underused space, unpredictable attendance, or a compliance gap with a works council), how many sites need coverage, what's already in the tech stack, and what privacy constraints apply to the workforce. These four answers eliminate most platforms that don't fit before a single demo is scheduled.
Next, weigh cost tier against actual feature scope. A budget-friendly tool may cover basic desk booking but lack attendance forecasting; an enterprise-tier platform may include portfolio-wide analytics a single-site company doesn't need yet. Buying the most expensive tier by default often means paying for capabilities that sit unused for the first year.
Before committing to a full rollout, pilot the platform on one site or floor to confirm data accuracy against known occupancy patterns. Use that pilot to evaluate two deciding factors directly: how much integration support the vendor provides, and whether anonymization defaults are strict out of the box rather than requiring manual configuration. Between two otherwise comparable platforms, those two factors tend to separate the one that scales smoothly from the one that generates support tickets for the next year.

Platforms typically combine badge-access logs, Wi-Fi connection data, desk booking records, and in some cases dedicated occupancy sensors to measure how space gets used. Some vendors deploy infrared or motion sensors for real-time desk and room counts, while others rely on existing IT infrastructure like network access points. Upflex builds its UnifyAI forecasting engine on scheduling inputs and utilization data rather than requiring new hardware, which shortens deployment timelines for multi-building portfolios.
Occupancy data turns real estate decisions from guesswork into evidence you can defend to a CFO. Tracking metrics like average and peak utilization rates reveals which floors are consistently underused and which are near capacity [3], informing lease renewal, consolidation, or redesign decisions. Pattern data also supports day-of-week coordination, helping teams align in-office schedules instead of showing up to half-empty floors.
Expect measurable reductions in real estate spend alongside better-attended office days, not just dashboards full of charts. Organizations using Upflex have documented 40%+ reductions in real estate spend and 88% co-attendance achievement by pairing 97% accurate attendance forecasting with portfolio consolidation decisions. The benefit shows up twofold: lower fixed costs and fewer complaints about desks not being available when teams do come in.
Most enterprise workplace analytics platforms sell on subscription terms scaled to headcount, square footage, or number of locations, landing anywhere from budget-friendly point tools to premium enterprise suites. Compare whether forecasting, desk booking, and external workspace access are bundled or sold as add-ons, since fragmented pricing often forces you to stitch together multiple vendor contracts to get full coverage.
Look for vendors who publish specific, attributable numbers rather than vague success stories. Proof points worth asking for include forecast accuracy rates, co-attendance percentages, and documented real estate spend reductions tied to actual portfolio decisions. Upflex points to 97% attendance forecast accuracy and 40%+ real estate savings as the kind of concrete, auditable outcomes finance and real estate leaders can take into a budget review.
Choosing a workplace analytics platform comes down to three questions: does it forecast attendance accurately enough to act on, does it turn utilization data into real estate decisions, and does it give employees flexibility without locking you into rigid mandates. A platform that only reports what already happened leaves the hard calls, consolidate, renew, or downsize, still resting on guesswork.
Start by pulling your last two quarters of badge or booking data and checking it against a 97%-accuracy forecasting benchmark like Upflex's UnifyAI engine. If the gap is wide, that's your evidence for the next lease review.
Explore more from our content library: