Share This Article
No items found.


The workplace utilization software features that pay off are the ones that turn raw occupancy data into direct real estate cost decisions: live occupancy sensing, desk and room booking analytics, integration with existing floor plans and IWMS systems, and forecasting that predicts attendance before it happens. Together these let corporate real estate and workplace teams see exactly which space goes unused, right-size leases or consolidate floors, and justify budget changes with data instead of guesswork. The payoff shows up as lower square footage per employee and fewer dollars spent on space nobody uses.
Continuous occupancy sensing replaces periodic headcounts with always-on data, catching usage patterns that a single walk-through or quarterly audit misses entirely.
Sensor-based systems and badge or Wi-Fi-based detection track presence floor by floor, hour by hour. A manual spot-check tells you a floor looked half-empty on Tuesday afternoon. Continuous sensing tells you it's been half-empty every Tuesday and Thursday for three months, a pattern, not a snapshot.
The core metrics are peak occupancy, average utilization by floor or neighborhood, and day-of-week attendance patterns [1]. Together they show not just how many people showed up, but where they clustered and when the office actually filled up versus when it just looked busy near the entrance.
This matters most for real estate teams managing multiple sites, where portfolio-wide visibility, not a single building's dashboard, drives the lease renewal or consolidation decision. The differentiator that separates mature workplace utilization software from a reporting tool: sensing data feeds directly into forecasting models instead of sitting static in a monthly PDF. Raw occupancy numbers become predictive inputs, which is what lets a real estate team catch an underused wing before the renewal deadline, not after.
AI-powered forecasting predicts who's coming into the office and when, turning facilities planning from a reactive guessing game into a scheduled operation.
Forecasting models combine historical attendance data, calendar entries, and desk booking patterns to project attendance days in advance. Upflex's UnifyAI engine, for example, forecasts attendance with 97% accuracy, precise enough that facilities teams can adjust cleaning schedules, catering orders, and front-desk staffing before the week starts instead of scrambling once people are already in the building. This matters most for organizations running hybrid schedules where attendance swings week to week rather than following a fixed five-day rhythm. Forecasting accuracy as a measurable, quoted metric, not just a historical report generated after the fact, is what separates mature platforms from basic booking tools that only tell you what already happened.
Forecasting also underpins co-attendance: predicting not just headcount but which teammates will actually overlap on the same day. Upflex tracks this directly, benchmarking 88% co-attendance achievement so teams can confirm hybrid schedules are delivering real in-person collaboration, not just filled desks.
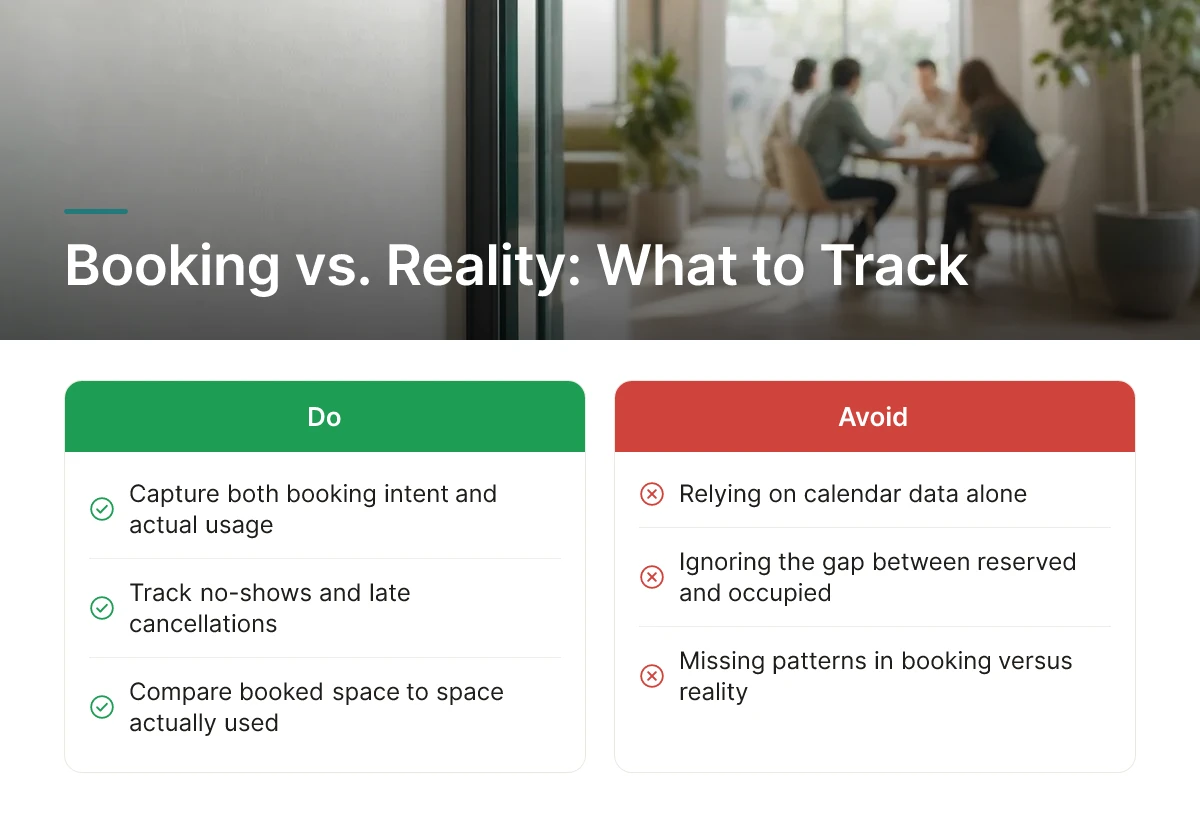
Booking tells you what was reserved; utilization analytics tells you what actually happened, and workplace utilization software needs both to be useful.
Desk booking, room booking, and occupancy analytics are three connected layers, not one feature. Desk and room booking capture intent, who reserved what. Occupancy analytics captures reality, tracking no-shows and late cancellations to expose the gap between booked space and space actually used [2]. A conference room booked five days a week but occupied twice tells a very different story than its calendar suggests.
That gap is the benefit: it surfaces chronically overbooked or underbooked rooms so facilities teams can reallocate square footage instead of guessing based on booking volume alone. This matters most for mid-market teams rolling out hybrid policies for the first time, they need adoption data showing whether the policy is working, not just a functioning calendar.
The differentiator worth asking vendors about: does booking behavior link to lease-level cost reporting, or does it stop at a usage percentage on a dashboard? Tying booking data to actual cost per square foot turns a convenience feature into a decision-support tool for the real estate team.
Access to a global network of flexible workspaces lets companies shed underused owned square footage without losing coverage in cities where they still need a presence.
This is the feature that extends utilization strategy beyond a company's own four walls. Instead of holding a full floor in a secondary market for a handful of employees who visit occasionally, teams book space on demand through a third-party network as needed. Upflex provides access to what it positions as the world's largest on-demand workspace network, letting distributed or traveling employees find a desk or meeting room wherever they're working from.
The benefit is a shift from fixed to variable cost: real estate spend tied to a long-term lease becomes spend tied to actual usage, which matters for companies consolidating a primary office while still needing occasional coverage elsewhere. This is best suited to organizations actively right-sizing a headquarters and backfilling secondary markets with flex space instead of renewing a lease they no longer need.
The differentiator few platforms offer: integrating network access data into the same utilization dashboard as owned-office data, so leaders compare both side by side rather than managing two disconnected systems and two separate cost reports.
Integration depth determines whether utilization data can be trusted for real estate decisions or just sits isolated in its own tool.
Hardware needs vary by platform, some rely on dedicated occupancy sensors installed per floor, others use existing badge readers or Wi-Fi access points to infer presence without new hardware [1]. The lighter the hardware footprint, the faster a rollout across multiple sites, which matters for enterprises trying to get portfolio-wide data without a multi-month installation project at every location.
Syncing with calendar systems like Outlook or Google Calendar validates booking data against actual meeting activity, confirming a reserved room was tied to a real scheduled event rather than a placeholder hold. Integration with an existing IWMS or facility management platform keeps floor plans and lease data connected to occupancy numbers, so a utilization report always maps back to the right building and cost center.
The benefit is eliminating manual reconciliation between space data and HR headcount records, a spreadsheet exercise that otherwise eats a real estate analyst's week every reporting cycle. This matters most for enterprises with established facility management infrastructure who can't justify a rip-and-replace project. The differentiator: an API-first architecture that supports phased integration, adding utilization data alongside a legacy IWMS like Archibus or Planon instead of forcing an all-or-nothing system replacement [5].

Scenario modeling lets a corporate real estate team simulate a lease decision, consolidating two floors or dropping a location entirely, and see the projected utilization impact before anyone signs a document.
Instead of guessing how employees will redistribute after a floor closes, the model projects desk demand, peak-day crowding, and collaboration space needs under each configuration. That turns a real estate decision from a gut call made under deadline pressure into a data-backed projection leadership can review line by line.
This feature is built for corporate real estate leaders assembling a renewal or consolidation business case ahead of a board or CFO conversation. The strongest implementations tie scenario outputs to cost-per-seat direction, flagging whether a given move pushes cost per seat lower, flat, or higher, rather than producing generic floor-plan visuals with no financial translation attached. Upflex applies this logic directly: its forecasting engine feeds portfolio-level scenario comparisons that support consolidation decisions tied to documented outcomes of 40%+ reduction in real estate spend.
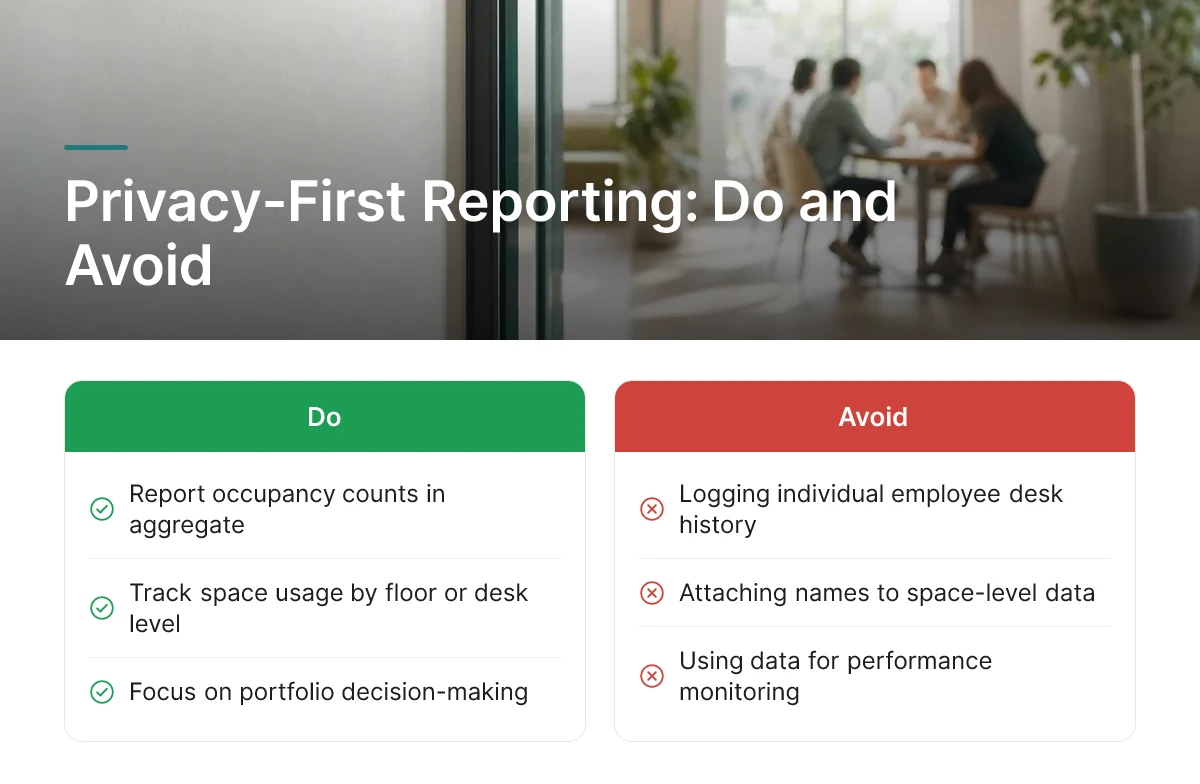
Good workplace utilization software reports on space usage, not individual employees, it aggregates data at the desk, room, or floor level rather than tracking who sat where.
The purpose of this category is portfolio decision-making, not performance monitoring. Platforms built for real estate optimization report occupancy counts and booking patterns in aggregate, a floor was 62% occupied on Tuesday, rather than logging an individual's desk history. That design choice is deliberate: real estate and finance leaders need space-level signal, and attaching names to it creates legal exposure without adding decision value.
Look for SOC 2-type security practices and data handling aligned with GDPR principles, data minimization, defined retention windows, and clear consent language, rather than taking a vendor's privacy claims at face value. You don't need exact certification numbers to evaluate this; ask the vendor to walk through what's collected, how long it's stored, and who can access raw records versus aggregated reports.
This approach pays off fastest in regulated industries or organizations with strong employee privacy expectations, EU operations subject to works council review, unionized workforces, or companies that have already faced pushback on monitoring tools. The differentiator to check for: anonymized, aggregated reporting as the default output, with individual-level tracking available only as an explicit opt-in add-on rather than baked into the core product. That distinction tends to determine how fast employees accept the rollout and how few objections facilities teams field during deployment.
ROI reporting should compare cost per occupied seat before and after utilization insights, not cost per leased seat, which hides the real waste.
A building can look fully leased on paper while running at 35% actual occupancy; cost per leased seat stays flat while cost per occupied seat tells the true story of wasted spend. Reporting should segment by floor, building, and business unit so a savings figure is traceable to a specific decision, closing a floor, relocating a team, or renegotiating a lease, rather than presented as one unexplained portfolio-wide number.
This benefits real estate leaders who need a defensible figure to bring into finance and leadership conversations, not a directional estimate. Finance-aligned real estate teams presenting quarterly cost impact get the most use out of this layer, since it's built to survive scrutiny in a budget review.
The differentiator worth checking: does the vendor tie its ROI number to forecast accuracy, how often predicted attendance matched actual turnout, as a credibility check on the savings claim? Upflex's UnifyAI engine reports 97% forecast accuracy, giving real estate teams a documented basis for trusting the utilization numbers behind its cost-savings reporting, alongside a benchmark of 88% co-attendance achievement that shows whether in-person collaboration goals are being met alongside the cost reduction.
Deployment speed matters as much as features, workplace utilization software that takes a year to go live delivers no savings during that year.
Mid-market deployments typically involve a lighter integration scope, one or two buildings, a single calendar system, a smaller employee base, which gets a first live dashboard running faster. Enterprise rollouts span multiple buildings, often require phased sensor installation floor by floor, and carry change management overhead across regions and business units, which stretches the timeline from weeks into months.
Regardless of company size, the path from purchase to live tracking generally follows the same steps: floor plan upload, integration setup with existing calendar or IWMS systems, employee onboarding, and a data validation period where early readings get checked against known occupancy before anyone trusts the dashboard for decisions.
The benefit is straightforward, shorter deployment means utilization data, and the cost decisions built on it, start flowing sooner instead of sitting in a pilot phase. This matters most for teams under pressure to show results within a budget cycle rather than committing to a multi-year rollout plan. The differentiator to prioritize: no-hardware or minimal-hardware deployment options that skip sensor installation entirely, relying instead on booking data, badge feeds, or calendar signals already in place.
Match the platform to four inputs: current office footprint, existing IWMS or calendar stack, privacy requirements, and growth trajectory.
Mid-market teams should weight fast deployment and clear ROI reporting most heavily, they need a usable dashboard and a defensible savings number within a single budget cycle, not a multi-quarter integration project. Enterprise teams should weight integration depth and multi-site scenario planning more heavily, since they're coordinating forecasts and lease decisions across buildings, regions, and sometimes legacy IWMS systems like Archibus or Planon that need to feed or be replaced by the new platform.
Pricing across this category runs from budget-friendly tools covering basic booking and occupancy counts, to mid-range platforms adding forecasting and reporting, to enterprise and premium tiers that bundle portfolio-wide scenario planning, on-demand workspace network access, and deeper integration support. Weigh the tier against feature depth and deployment scope, not sticker price alone.
Before committing to a portfolio-wide rollout, pilot on one floor or building. A single-site pilot validates forecast accuracy and reporting quality against your own data before you scale the decision, and the spend, company-wide.

Many enterprises cut real estate spend by 30–40% once they have accurate attendance and occupancy data. Upflex customers document 40%+ reductions in real estate spend by pairing attendance forecasting with portfolio consolidation decisions, rather than guessing which floors or buildings to give up.
Utilization software measures how space is used in aggregate; monitoring tools track individual behavior. Platforms like Upflex forecast attendance patterns and desk demand at the team or floor level to guide real estate decisions, they're not built to watch individual employees, which matters when HR and legal teams review a rollout.
Most platforms aggregate badge, booking, and sensor data into anonymized occupancy patterns rather than per-person tracking. The goal is answering "how full is this floor on Tuesdays," not "where is this specific employee", a distinction worth confirming during vendor evaluation.
Implementation typically means connecting calendar or HR systems, mapping floor plans, and setting booking rules before data starts flowing. Sensor-based platforms add hardware installation time; software relying on booking and badge data, like Upflex, can launch faster since it avoids new hardware deployment.
It targets lease renewal decisions, consolidation of underused floors or buildings, and avoiding new leases signed on guesswork. Forecasting attendance before a renewal date lets corporate real estate leaders negotiate from data instead of assumption.
Workplace utilization software only pays off when forecasting, booking, and real estate decisions sit on the same data. Treat occupancy numbers as a lease-renewal input, not a dashboard curiosity, and favor platforms that forecast attendance before it happens rather than reporting on it after the fact.
Upflex applies this directly: UnifyAI forecasts attendance at 97% accuracy, desk booking runs on that forecast, and the on-demand workspace network absorbs overflow without a new lease. Customers have used this combination to cut real estate spend by more than 40% while hitting 88% co-attendance targets.
Start by pulling your last two quarters of badge or booking data and comparing it against your current square footage before your next lease conversation.
Explore more from our content library: