Share This Article
No items found.

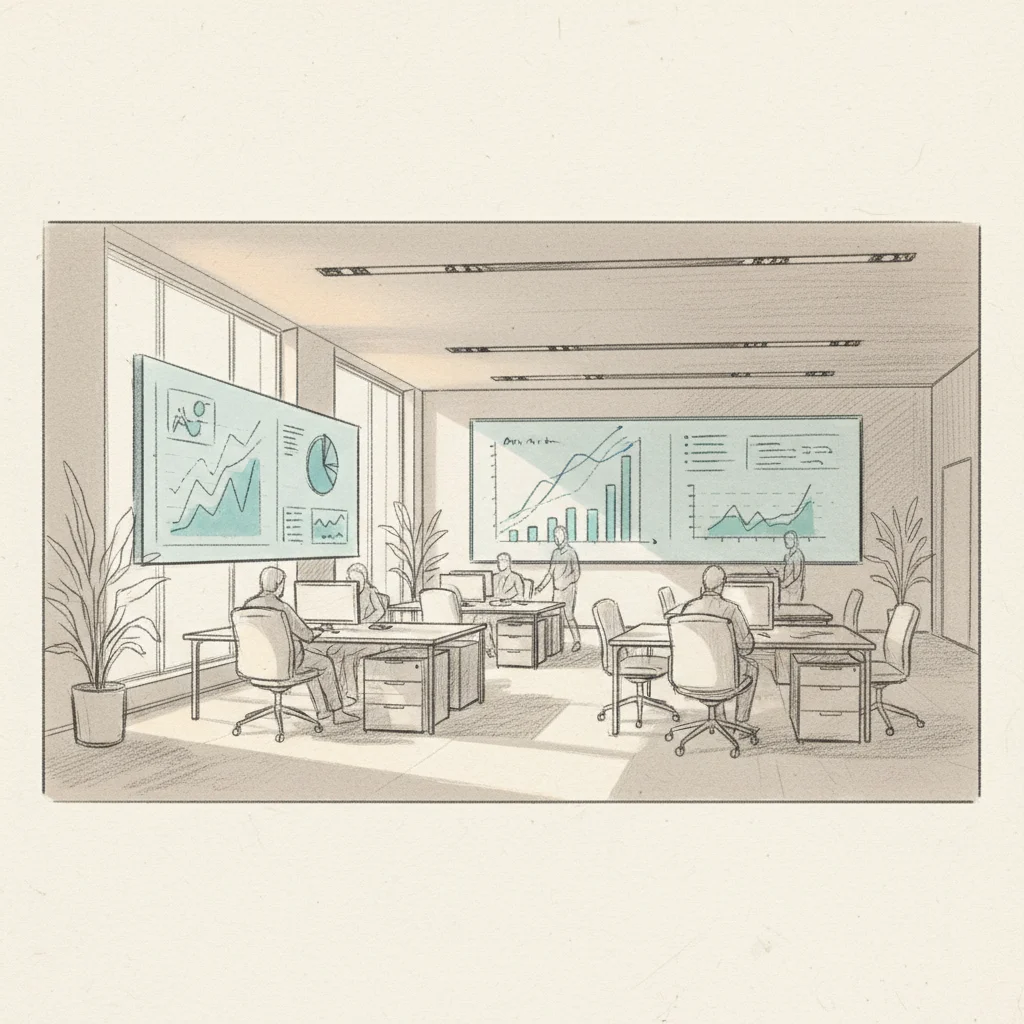
Half-empty floors on a Tuesday. Packed conference rooms on a Thursday nobody planned for. If that sounds familiar, you're not alone. Workplace analytics software is the category of technology that turns raw office data into actionable intelligence, helping corporate real estate, HR, and finance leaders make smarter decisions about space, people, and cost. It collects data from sensors, booking systems, calendars, and HR platforms, then surfaces patterns that would otherwise stay invisible in a spreadsheet.
This guide covers everything you need to know about workplace analytics software as of 2026: how it works, what benefits it delivers, the mistakes organizations make when deploying it, and the best practices that separate high-performing hybrid workplaces from expensive, underutilized ones.
Workplace analytics software is a technology platform that aggregates, analyzes, and visualizes data about how physical office space and distributed workforces are actually used. It connects to sensors, badge readers, desk booking systems, calendars, and HR tools to build a continuous, data-driven picture of space utilization, attendance patterns, and collaboration behavior.
Corporate real estate is typically the second or third largest operating cost for an enterprise. Yet most organizations still make portfolio decisions based on headcount projections and gut feel rather than verified utilization data. According to research compiled by Engage for Success, underutilized office space is one of the leading drivers of avoidable real estate spend [1]. Workplace analytics software closes that gap by replacing assumptions with evidence.
The category spans several distinct use cases:
Workplace analytics and workforce analytics are related but distinct. Workforce analytics (sometimes called people analytics) focuses on HR outcomes: turnover risk, performance, hiring pipeline, and compensation equity [2]. this method focuses on the physical and operational dimension: where people work, when they show up, and how efficiently space is consumed. The two categories increasingly overlap as platforms like Microsoft Viva Insights (formerly Microsoft Workplace Analytics) combine collaboration signals with space data [3].
For corporate real estate leaders, the distinction matters because the primary ROI from this strategy is measured in square footage reduced and lease costs avoided, not in HR metrics.
Modern this approach follows a four-stage pipeline: data collection, integration, analysis, and action. Each stage has grown significantly more sophisticated as AI capabilities have matured through 2024 and 2025.
The quality of any analytics output depends entirely on the quality of its inputs. Leading platforms pull data from multiple sources simultaneously [4]:
According to Deskbird's hybrid work research, organizations that integrate at least three data sources into their workplace analytics platform report significantly more accurate space utilization readings than those relying on a single input [4].
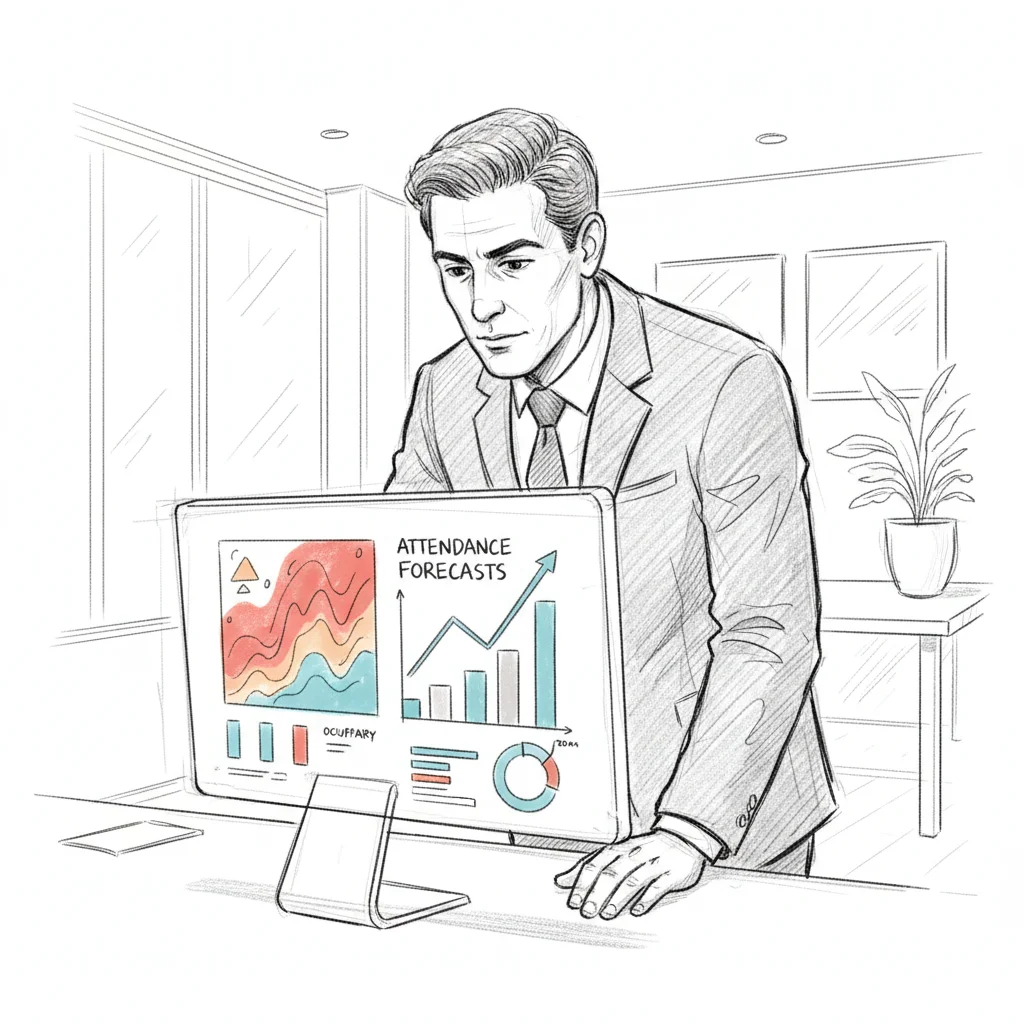
The defining shift in 2026 is the move from descriptive analytics (what happened last week) to predictive and prescriptive analytics (what will happen tomorrow, and what should you do about it). AI engines now process historical attendance patterns, calendar signals, and team scheduling preferences to forecast future occupancy with high accuracy.
Upflex's UnifyAI engine is one example of this evolution. It forecasts office attendance with 97% accuracy, enabling workplace teams to allocate space, coordinate team co-attendance, and avoid both overcrowding and ghost-floor scenarios before they happen. That's a fundamentally different capability than reviewing last month's badge swipe report after the fact.
Platforms like FM:Systems automate the data gathering and reporting layer, providing objective intelligence on employee mobility and space utilization without requiring manual analysis [5]. The best platforms don't just report; they recommend. They surface which floors to close on low-attendance days, which teams need co-location support, and which leases are candidates for consolidation.
| Capability Type | What It Does | Example Output | Business Value |
|---|---|---|---|
| Descriptive | Reports on past utilization | Floor 3 was 42% occupied last Tuesday | Baseline benchmarking |
| Diagnostic | Explains why patterns occur | Low Monday attendance correlates with remote team distribution | Root-cause insight |
| Predictive | Forecasts future attendance | Next Thursday: 78% occupancy expected on floors 2–4 | Proactive space management |
| Prescriptive | Recommends specific actions | Close floor 5 Mon/Fri; consolidate teams A and B on floor 2 | Direct cost reduction |
The primary business case for the practice rests on three pillars: cost reduction, employee experience improvement, and data-driven real estate decision-making. Each is measurable, and each compounds over time as the platform accumulates more historical data.
This is where the financial case is clearest. When you know that 35% of your desks sit empty every Monday and Friday, you have the evidence to consolidate floors, renegotiate leases, or exit locations entirely. Upflex customers achieve 40%+ reductions in real estate spend by combining utilization data with AI-powered forecasting to right-size their portfolios with confidence rather than guesswork.
According to OccupEye's workplace analytics research, organizations that implement structured space utilization monitoring consistently identify 20–40% of their office inventory as underutilized [1]. That's not a rounding error; it's a material cost reduction opportunity sitting in plain sight.
The financial benefits extend beyond lease savings:
this practice doesn't just serve the CFO. It also solves the employee-side problem: coming into the office and finding no desk, no quiet space, or none of your teammates present. Industry analysts at Visier note that organizations using people and workplace data together report measurably higher employee satisfaction scores and lower voluntary turnover [6].
Platforms that track co-attendance (whether the right teammates are in the office on the same days) address one of the most common complaints about hybrid work: the commute wasn't worth it because nobody else was there. Upflex's UnifyAI achieves 88% co-attendance rates for teams using its coordination features, which translates directly into a more purposeful in-office experience.
For organizations exploring how content and communication analytics intersect with workplace engagement, Digital Publishing Analytics platforms offer complementary insights into how internal communications reach and resonate with distributed teams.
Pro Tip: Don't evaluate workplace analytics software on space utilization metrics alone. Track co-attendance rates by team as a leading indicator of collaboration quality. A floor that's 70% occupied but has zero cross-team interaction is not a healthy workplace.
Deploying this method is straightforward in theory. In practice, most organizations stumble in one of three predictable ways: poor data quality, employee trust issues, or treating the platform as a reporting tool rather than a decision engine.
A common mistake is deploying sensors or booking systems in isolation without integrating them into a unified analytics layer. The result is siloed data that tells you how many desks were booked (from the booking system) but not how many were actually used (from sensors), creating a false picture of utilization. OfficeSpace Software's analytics documentation emphasizes that effective workplace analytics requires unified dashboards that reconcile multiple data streams, not separate reports from separate tools [7].
From experience working with large hybrid organizations, the most common integration failure is between calendar data and physical occupancy data. Teams show up on days that weren't in the calendar, and the analytics platform misses them entirely, leading to systematic underreporting of actual utilization.
One pitfall that derails many workplace analytics deployments is employee backlash over perceived surveillance. This is a legitimate concern, and it's worth addressing head-on rather than hoping nobody notices. The distinction between monitoring individual behavior and aggregating anonymized space utilization data is critical, both ethically and legally.
Best-in-class platforms aggregate data at the team or floor level rather than tracking individual movements. As of 2026, organizations operating in the EU must also ensure their workplace analytics data practices comply with GDPR Article 5 principles of data minimization and purpose limitation. The Washington State Office of Financial Management's workforce analytics guidelines provide a useful public-sector framework for privacy-respecting data governance that enterprise teams can adapt [8].
Key mistakes to avoid:
Pro Tip: Before your first analytics rollout, publish a one-page internal FAQ explaining exactly what your workplace analytics software tracks, what it doesn't track, and how the data will be used. Transparency upfront prevents the trust erosion that kills adoption later.
Organizations that extract the most value from this strategy share a common pattern: they treat it as an ongoing operational discipline, not a one-time deployment project. Here's what that looks like in practice.
Don't make real estate decisions in the first 90 days. Collect at least one full quarter of utilization data before drawing conclusions about which spaces to consolidate or which days to close floors. Seasonal variation, project cycles, and onboarding waves all distort short-term readings.
Research from Elia's workplace transformation guide confirms that organizations with a documented utilization baseline achieve significantly faster ROI from workplace analytics investments than those that skip this step [9].
The most common failure mode in mature analytics programs is metric proliferation: tracking dozens of KPIs with no clear connection to business decisions. At Upflex, we've found that the most effective workplace analytics programs focus on a small set of outcome-linked metrics rather than maximizing dashboard complexity.
| Stakeholder | Primary KPI | Secondary KPI | Decision It Drives |
|---|---|---|---|
| Corporate Real Estate | Peak utilization rate | Cost per occupied desk | Lease consolidation |
| Finance / CFO | Real estate cost per head | Forecasted vs. actual occupancy | Budget allocation |
| HR / People Ops | Co-attendance rate | Employee satisfaction with workspace | Hybrid policy design |
| Facilities / IT | Booking-to-presence accuracy | Energy consumption per occupied zone | Space activation schedules |
According to People Managing People's 2026 review of workforce analytics platforms, the tools that deliver the highest user satisfaction are those that surface role-specific dashboards rather than forcing every stakeholder through the same generic reporting interface [2].
MIT Professional Education's research on AI and the future of workplace analytics highlights that organizations adopting prescriptive AI frameworks (not just descriptive reporting) are achieving 2–3x faster decision cycles on real estate portfolio changes [10].
Pro Tip: Run a quarterly "analytics audit" with your core stakeholders. Review which metrics are being actively used to make decisions and which are just being reported. Cut the latter. Focused metrics drive action; dashboard overload drives paralysis.
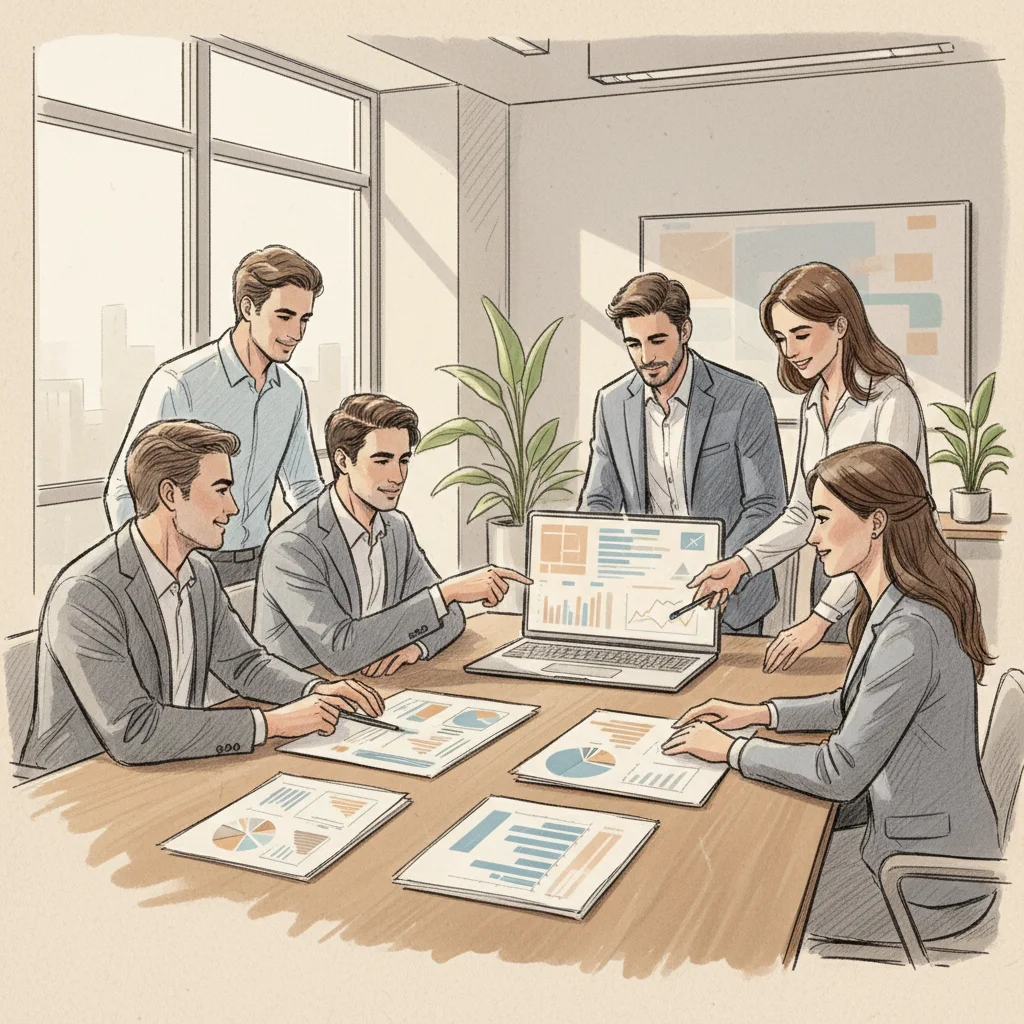
this approach measures space utilization (how often and how fully desks, rooms, and floors are used), attendance patterns (when and how many employees come in), collaboration behavior (which teams interact in person), and booking accuracy (whether reserved spaces are actually occupied). Advanced platforms also forecast future attendance and recommend space allocation adjustments before occupancy problems occur.
Desk booking tools tell you where people planned to sit. the practice tells you where they actually sat, when they came in, how often bookings were honored, and what patterns emerge over time. The booking system is one data input into the analytics platform. Upflex, for example, combines desk booking with AI-powered attendance forecasting and utilization reporting, giving you the full picture rather than just reservation logs.
Most enterprise-grade this practice is designed for organizations with 200+ employees across multiple locations, where the ROI from space optimization justifies the investment. Smaller businesses with a single office and fewer than 100 employees may find simpler occupancy sensors or basic booking tools sufficient. Results vary significantly based on office footprint size and the complexity of your hybrid work model.
Traditional workplace analytics reporting is descriptive: it tells you what happened. AI-powered platforms like Upflex's UnifyAI are predictive and prescriptive: they forecast what will happen and recommend what to do about it. That shift from reactive to proactive management is what enables 97% attendance forecast accuracy and the kind of portfolio decisions that produce 40%+ reductions in real estate spend.
As of 2026, organizations in the EU must comply with GDPR principles of data minimization and purpose limitation when deploying workplace analytics tools. Best practice is to aggregate data at the team or zone level rather than tracking individuals, publish a clear internal policy explaining what is collected, and appoint a data steward. One limitation to note: what's legally permissible varies by jurisdiction, so legal review before deployment is strongly recommended.
Most organizations see initial insights within 60–90 days of deployment, once a utilization baseline is established. Measurable financial ROI (lease consolidation, reduced facilities costs) typically materializes within 6–18 months, depending on lease cycle timing and the pace of portfolio decisions. Organizations that use predictive analytics to front-load their decision-making, rather than waiting for annual reviews, tend to reach positive ROI faster.
At minimum, look for integrations with your calendar platform (Microsoft 365 or Google Workspace), your HRIS, and any existing access control or badge systems. Sensor compatibility (for real-time occupancy data) and desk booking system integration are also critical. Platforms that offer a unified API layer, rather than requiring point-to-point integrations for each data source, are significantly easier to maintain at enterprise scale.
The best this method for hybrid teams combines attendance forecasting, space utilization tracking, and co-attendance coordination in a single platform. Upflex stands out by pairing proprietary AI orchestration (97% forecast accuracy) with access to a global on-demand workspace network, so your analytics don't just measure your owned offices but inform decisions across your entire real estate portfolio, including flexible and third-party spaces.
this strategy has moved from a nice-to-have reporting tool to a core operational capability for any enterprise managing hybrid work at scale. The organizations winning on real estate efficiency in 2026 aren't the ones with the most office space; they're the ones with the clearest picture of how that space is actually used, and the AI-powered tools to act on that picture before costs compound.
The business case is concrete. Cut real estate spend by 40%+. Achieve 88% team co-attendance. Forecast attendance with 97% accuracy. These aren't aspirational benchmarks; they're outcomes Upflex delivers through its combination of UnifyAI-powered workplace analytics and access to the world's largest on-demand workspace network.
If your organization is still making portfolio decisions based on headcount projections and badge swipe averages, you're leaving significant money on the table. this approach gives you the evidence to make better decisions faster, with confidence you can take to the CFO and outcomes your employees will actually feel.
Explore more from our content library: