Share This Article
No items found.

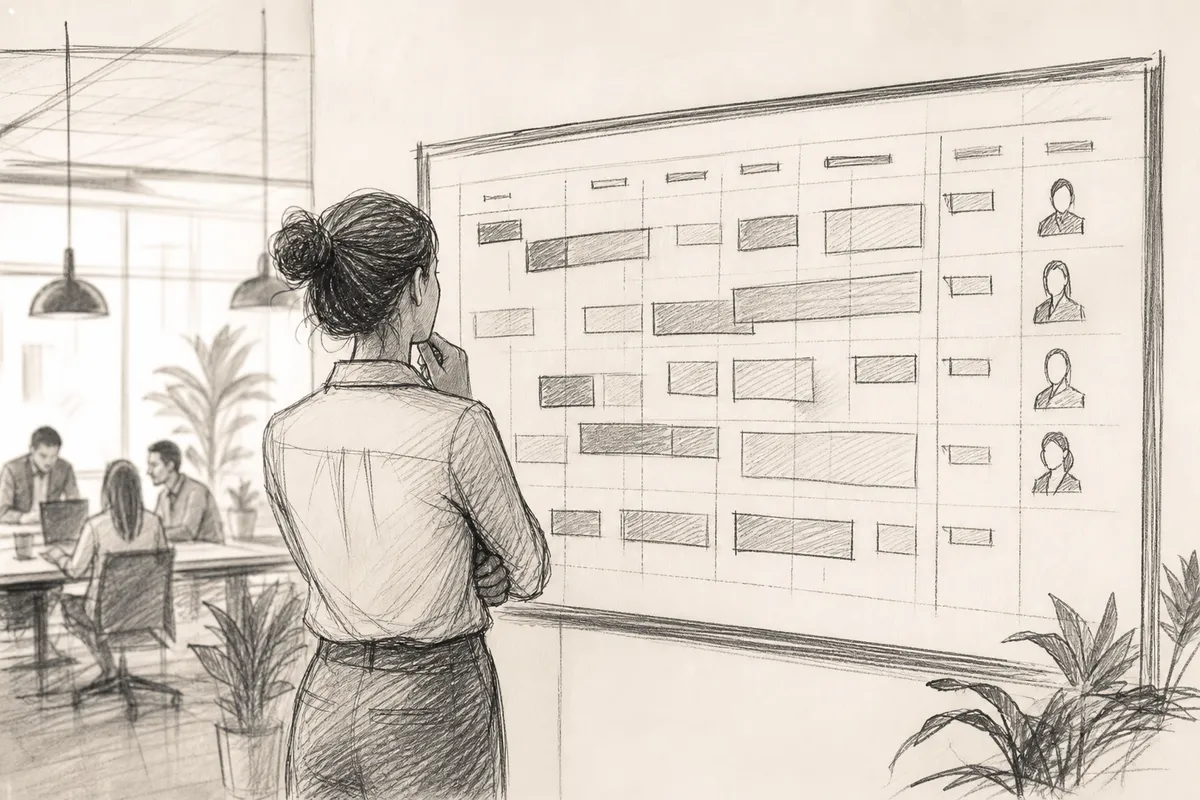
Workplace demand planning is the process of forecasting how much office space, seating, and support your teams will actually need, by day, department, and location, so real estate and staffing decisions match real usage instead of guesswork. It differs from supply chain demand planning in what's being predicted: instead of forecasting product or inventory demand, it forecasts human attendance patterns, hybrid schedules, and headcount shifts. Getting it right prevents two costly outcomes: paying for empty desks or scrambling because too many people showed up on the same day.
Supply chain demand planning forecasts what products customers will buy; this discipline applied to offices forecasts which employees will show up, where, and on what day [1]. Both borrow the same forecasting logic, but the object being predicted is completely different. This is particularly relevant for workplace demand planning.
Traditional demand planning, the kind that dominates most search results on this topic, sits inside supply chain management. It forecasts SKU-level demand so a company can set inventory levels, avoid stockouts, and keep production aligned with what customers actually order [1]. For a deeper look at how that discipline works in a supply chain context, see this overview of demand planning fundamentals. The workplace version applies a parallel discipline to people instead of products, forecasting attendance, seating needs, and space utilization by department, floor, and location.
Fixed-office companies had an easy forecasting problem: the same people showed up five days a week, so headcount equaled seat count. Hybrid work broke that equation. Schedules now vary by employee, team, and week, which means the "demand" side of the equation, how many people need a desk on any given Tuesday, has become a moving target instead of a constant.
This is why forecasting attendance and space needs has emerged as its own function. Without a forecast, real estate and workplace teams are left guessing between two bad outcomes: understaffing the office on high-attendance days or overbuilding for a peak that rarely happens.
Accurate attendance forecasts let a company lease for actual usage instead of worst-case peak days, which is where most wasted real estate spend originates. When leadership doesn't know whether Monday or Wednesday will bring 40% or 80% attendance, the safe default is to lease for the higher number every time. Upflex's UnifyAI engine addresses this directly by forecasting attendance with 97% accuracy, giving corporate real estate and finance leaders a data-backed basis to consolidate square footage rather than defend it out of caution. That forecast becomes the input for portfolio decisions, how many floors to keep, which leases to renew, and how much desk capacity a given office actually requires.
The process is built in five sequential phases, baseline data collection, pattern analysis, forecast modeling, pilot rollout, and recalibration, with HR, facilities, and finance sharing one forecast throughout. When considering workplace demand planning, this point stands out.
Start with baseline data collection before touching any modeling software. You need at least one full quarter of raw attendance signals, badge swipes, desk booking logs, VPN or network access records, plus a snapshot of current headcount by team and location.
Next comes pattern analysis: sorting that baseline data by day of week, team, floor, and season to find the recurring shapes in attendance rather than the noise. Most enterprises find Tuesday through Thursday attendance clusters well above Monday and Friday, but the actual ratios vary by function and region, so this step has to be run on your own data, not assumed from industry lore.
Forecast modeling comes third. This is where a platform like Upflex applies its UnifyAI engine to the pattern data to predict attendance by day, team, and location with 97% accuracy, replacing gut-feel estimates with a number facilities and finance can both plan against.
Pilot the forecast in one or two buildings before rolling it out portfolio-wide. Then build in continuous recalibration, the forecast is a living input, not a one-time report.
Siloed planning creates conflicting decisions because each team optimizes for a different number pulled from a different source. HR tracks headcount and policy changes, facilities tracks square footage and lease terms, and finance tracks budget targets, when each runs its own estimate, facilities might hold space for growth HR hasn't confirmed, while finance pushes for cuts based on stale occupancy data. For those exploring workplace demand planning, this matters.
A single shared forecast forces all three to work from the same attendance and headcount assumptions, so a lease decision and a budget decision are never made on conflicting information.
Tie review cadence to events that actually change demand, quarterly headcount reviews, lease renewal windows, or major reorganizations, rather than an arbitrary calendar date. For more information, see Blog.
Before modeling begins, assemble: badge and access data, calendar and meeting data, team-level hybrid policies, and planned headcount changes for the next two to three quarters. If your organization is building out this function for the first time, it can also help to understand how demand planning careers and skill sets typically develop, since the analytical skill set transfers well from traditional supply chain roles.

This kind of forecasting rests on four core metrics: peak-day occupancy, average utilization rate, seat-to-employee ratio, and department-level attendance variance. Each answers a different question, and treating them as one blended number is where most plans go wrong.
Peak-day occupancy shows the busiest day your office needs to absorb, not the average, the number a lease or floor plan actually has to support. Average utilization rate tells you how efficiently space gets used across a full week or month. Seat-to-employee ratio compares desks available to headcount assigned, the figure finance leaders lean on when sizing a downsizing case. Department-level attendance variance captures how far individual teams swing from the company-wide average, which is usually wide. This directly impacts workplace demand planning outcomes.
Two forecasting methods dominate. Trailing-average models, which project future attendance from the past 8 to 12 weeks of actual data, work well for stable teams with settled hybrid schedules. Scenario-based modeling, building separate projections for a reorg, a hiring surge, or a merger, fits teams facing change the trailing average can't anticipate, since historical patterns break down the moment headcount or policy shifts.
Forecast department by department and site by site, not as one company-wide average, because attendance patterns diverge sharply by function. Sales teams cluster around client-facing days, engineering often skews remote, and finance may hold rigid in-office anchor days tied to close-of-month cycles. A single blended forecast masks these differences and leads to space that's wrong for everyone.
Accurate predictions need four inputs working together: badge-in data for actual arrivals, room and desk booking logs for intent, calendar acceptance data for meeting-driven attendance, and manager-reported hybrid schedules for policy context. Upflex's UnifyAI engine combines these inputs to forecast attendance at 97% accuracy, turning fragmented signals into a single, department-level view rather than a company-wide guess.
Purpose-built software pulls badge swipes, desk bookings, and calendar data into one system that generates attendance and space forecasts automatically, without a planner rebuilding a spreadsheet every quarter.
This category sits distinct from general facilities management suites. Its job is narrower and more specific: predict who's coming in, when, and to which floor or team neighborhood, then turn that prediction into a booking and space-allocation workflow employees actually use. This is particularly relevant for workplace demand planning.
AI models recalibrate forecasts continuously as new attendance signals arrive, instead of locking in a static estimate that goes stale within weeks.
A manual spreadsheet model typically reflects a quarterly snapshot, HR headcount plus a rough hybrid-policy assumption. It doesn't adjust when a team shifts its in-office days or when a reorg moves 40 people to a new department. Upflex's UnifyAI engine, by contrast, ingests booking and attendance patterns on an ongoing basis and forecasts attendance with 97% accuracy, which lets facilities teams plan desk allocation and co-attendance coordination day by day rather than quarter by quarter.
Evaluate platforms against four concrete criteria rather than a generic feature checklist.
Cost tiers vary widely, from budget-friendly point tools that handle booking alone to enterprise platforms that bundle forecasting with full real estate portfolio management. The right tier depends on whether you're solving a desk-booking problem or a portfolio-consolidation problem.
Most failures trace back to three root causes: forecasting from the wrong baseline, letting the model go stale, and ignoring how differently teams actually behave. When considering workplace demand planning, this point stands out.
Over-provisioning happens when planners size the office to peak attendance, the busiest Tuesday of the quarter, instead of typical daily demand. That single decision locks in years of excess leased square footage, because once a lease is signed at peak-day capacity, the fixed cost persists even as actual daily attendance settles well below it.
Under-provisioning is the opposite failure, and it's just as damaging to the employee experience. It happens when planners average attendance across the entire company rather than by team. A companywide average of 55% utilization can hide the fact that the product and sales teams both show up Tuesday through Thursday, overwhelming desks and meeting rooms on exactly the days collaboration matters most.
The fix for both is the same discipline: forecast at the team level, not the portfolio level, and validate against actual swipe or booking data before committing to a real estate decision. Upflex's UnifyAI engine addresses this directly by forecasting attendance with 97% accuracy at the team level, which lets real estate leaders size space to genuine demand patterns instead of guesswork in either direction.
Stale data is the third failure point. A forecast built once, say, right after a return-to-office mandate, starts drifting the moment headcount changes, a team reorganizes, or a hybrid policy loosens. Because nobody recalibrates, small errors compound quarter over quarter until the space plan and the actual workforce no longer resemble each other.
Demand patterns differ sharply by industry, and a single model rarely transfers cleanly. A retail chain or hospital planning frontline labor is managing shift coverage against customer traffic or patient volume, a fundamentally different variance profile than a professional services firm coordinating hybrid office days around meeting schedules and project deadlines. Applying an office-attendance model to a shift-staffing problem, or vice versa, produces forecasts that miss the actual driver of demand. For those exploring workplace demand planning, this matters.
The corrective practice across every industry is the same: rolling forecast reviews on a set cadence, with a feedback loop that feeds actual utilization data back into the model so it self-corrects rather than drifts.

No, they're related but distinct disciplines. Space planning designs the physical layout, desks, meeting rooms, square footage per floor, while this forecasting process predicts how many people will actually show up on a given day and where. Demand planning informs space planning decisions, but a company can have a well-designed floor plan and still misjudge demand.
Most companies update forecasts weekly, with a rolling look-ahead of two to four weeks. Hybrid schedules shift often enough that monthly updates miss real changes in team behavior, while daily forecasts add overhead without much added accuracy for most office footprints.
Ownership typically sits with corporate real estate or workplace strategy teams, but the process fails without HR and finance involved. HR supplies headcount and hybrid policy data, finance sets the cost targets driving portfolio decisions, and real estate translates both into space and lease strategy. Treating it as a single-department task is a common reason forecasts miss the mark.
Smaller companies benefit too, though the stakes and complexity scale with headcount and office count. A 50-person company with one office can track attendance patterns in a spreadsheet; a 5,000-person company across a dozen cities needs automated forecasting to catch patterns humans would miss. This directly impacts workplace demand planning outcomes.
Headcount planning forecasts how many people a company employs; this process forecasts how many of them use office space, and when. A team can grow headcount 20% while office demand stays flat if hybrid adoption increases, the two numbers move independently, not in lockstep.
Workplace demand planning turns office decisions from guesswork into a repeatable process built on real attendance data, not lease renewal anxiety or gut instinct. The companies getting this right forecast at the team level, update on a weekly cadence, and connect the numbers to actual lease and consolidation decisions rather than letting the data sit in a dashboard.
Start by pulling six months of badge or booking data for your largest office and comparing it against your current square footage per employee. If the gap looks large, that's the office to pilot a forecasting-driven right-sizing decision on first.
Explore more from our content library: